inception-app-prod/ZDFmOWMzYTktNzU4Zi00YTIzLTk3MjYtYThkN2JkMGVlYzA3/logo/2019/01/WwithModern Living Sonoma_logo_white.png
  • Home
  • About
  • Blog
  • Blog Sign Up
  • Newsletter Sign Up
  • Recommendations
  • Get In Touch
  • Market Data
    • Healdsburg 2021 Market Analysis
    • Russian River 2021 Market Analysis
    • Sebastopol 2021 Market Analysis
    • Sonoma 2021 Market Analysis
    • Vacation Rental Index
    • Sonoma Vacation Rental Analysis
    • Sebastopol Vacation Rental Analysis
    • Guerneville Vacation Rental Analysis
    • Healdsburg Vacation Rental Analysis
    • Occidental Vacation Rental Analysis
    • Santa Rosa Vacation Rental Analysis
    • Windsor Vacation Rental Analysis
    • Cloverdale Vacation Rental Analysis
    • Healdsburg Housing Market Data
    • Sebastopol Housing Market Data
    • Sonoma Housing Market Data
    • Russian River Housing Market Data
    • Santa Rosa Housing Market Data
David Hargreaves
inception-app-prod/ZDFmOWMzYTktNzU4Zi00YTIzLTk3MjYtYThkN2JkMGVlYzA3/content/2020/11/craftworkportrait.jpg
707 238 2112
david@modernlivingsonoma.com
Sign In
Sign Up
inception-app-prod/ZDFmOWMzYTktNzU4Zi00YTIzLTk3MjYtYThkN2JkMGVlYzA3/logo/2019/01/WwithModern Living Sonoma_logo_white.png
  • Home
  • About
  • Blog
  • Blog Sign Up
  • Newsletter Sign Up
  • Recommendations
  • Get In Touch
  • Market Data
    • Healdsburg 2021 Market Analysis
    • Russian River 2021 Market Analysis
    • Sebastopol 2021 Market Analysis
    • Sonoma 2021 Market Analysis
    • Vacation Rental Index
    • Sonoma Vacation Rental Analysis
    • Sebastopol Vacation Rental Analysis
    • Guerneville Vacation Rental Analysis
    • Healdsburg Vacation Rental Analysis
    • Occidental Vacation Rental Analysis
    • Santa Rosa Vacation Rental Analysis
    • Windsor Vacation Rental Analysis
    • Cloverdale Vacation Rental Analysis
    • Healdsburg Housing Market Data
    • Sebastopol Housing Market Data
    • Sonoma Housing Market Data
    • Russian River Housing Market Data
    • Santa Rosa Housing Market Data
inception-app-prod/ZDFmOWMzYTktNzU4Zi00YTIzLTk3MjYtYThkN2JkMGVlYzA3/logo/2019/01/WwithModern Living Sonoma_logo_white.png
inception-app-prod/ZDFmOWMzYTktNzU4Zi00YTIzLTk3MjYtYThkN2JkMGVlYzA3/content/2020/01/screen-shot-2020-01-21-at-9.57.08-am.png
Market Insight

The Facts and Figures Of The Sonoma County 2019 Housing Market

inception-app-prod/ZDFmOWMzYTktNzU4Zi00YTIzLTk3MjYtYThkN2JkMGVlYzA3/content/2020/11/craftworkportrait.jpg
David Hargreaves,01/20/2020

$1m+ Housing Market Weakens Through 2019

As we move into 2020, the macro economic factors that point towards a continuing of the strong property market are all positive: low interest rates, consumer confidence indices and a strong stock market which typically climbs 10% in a presidential election year. 

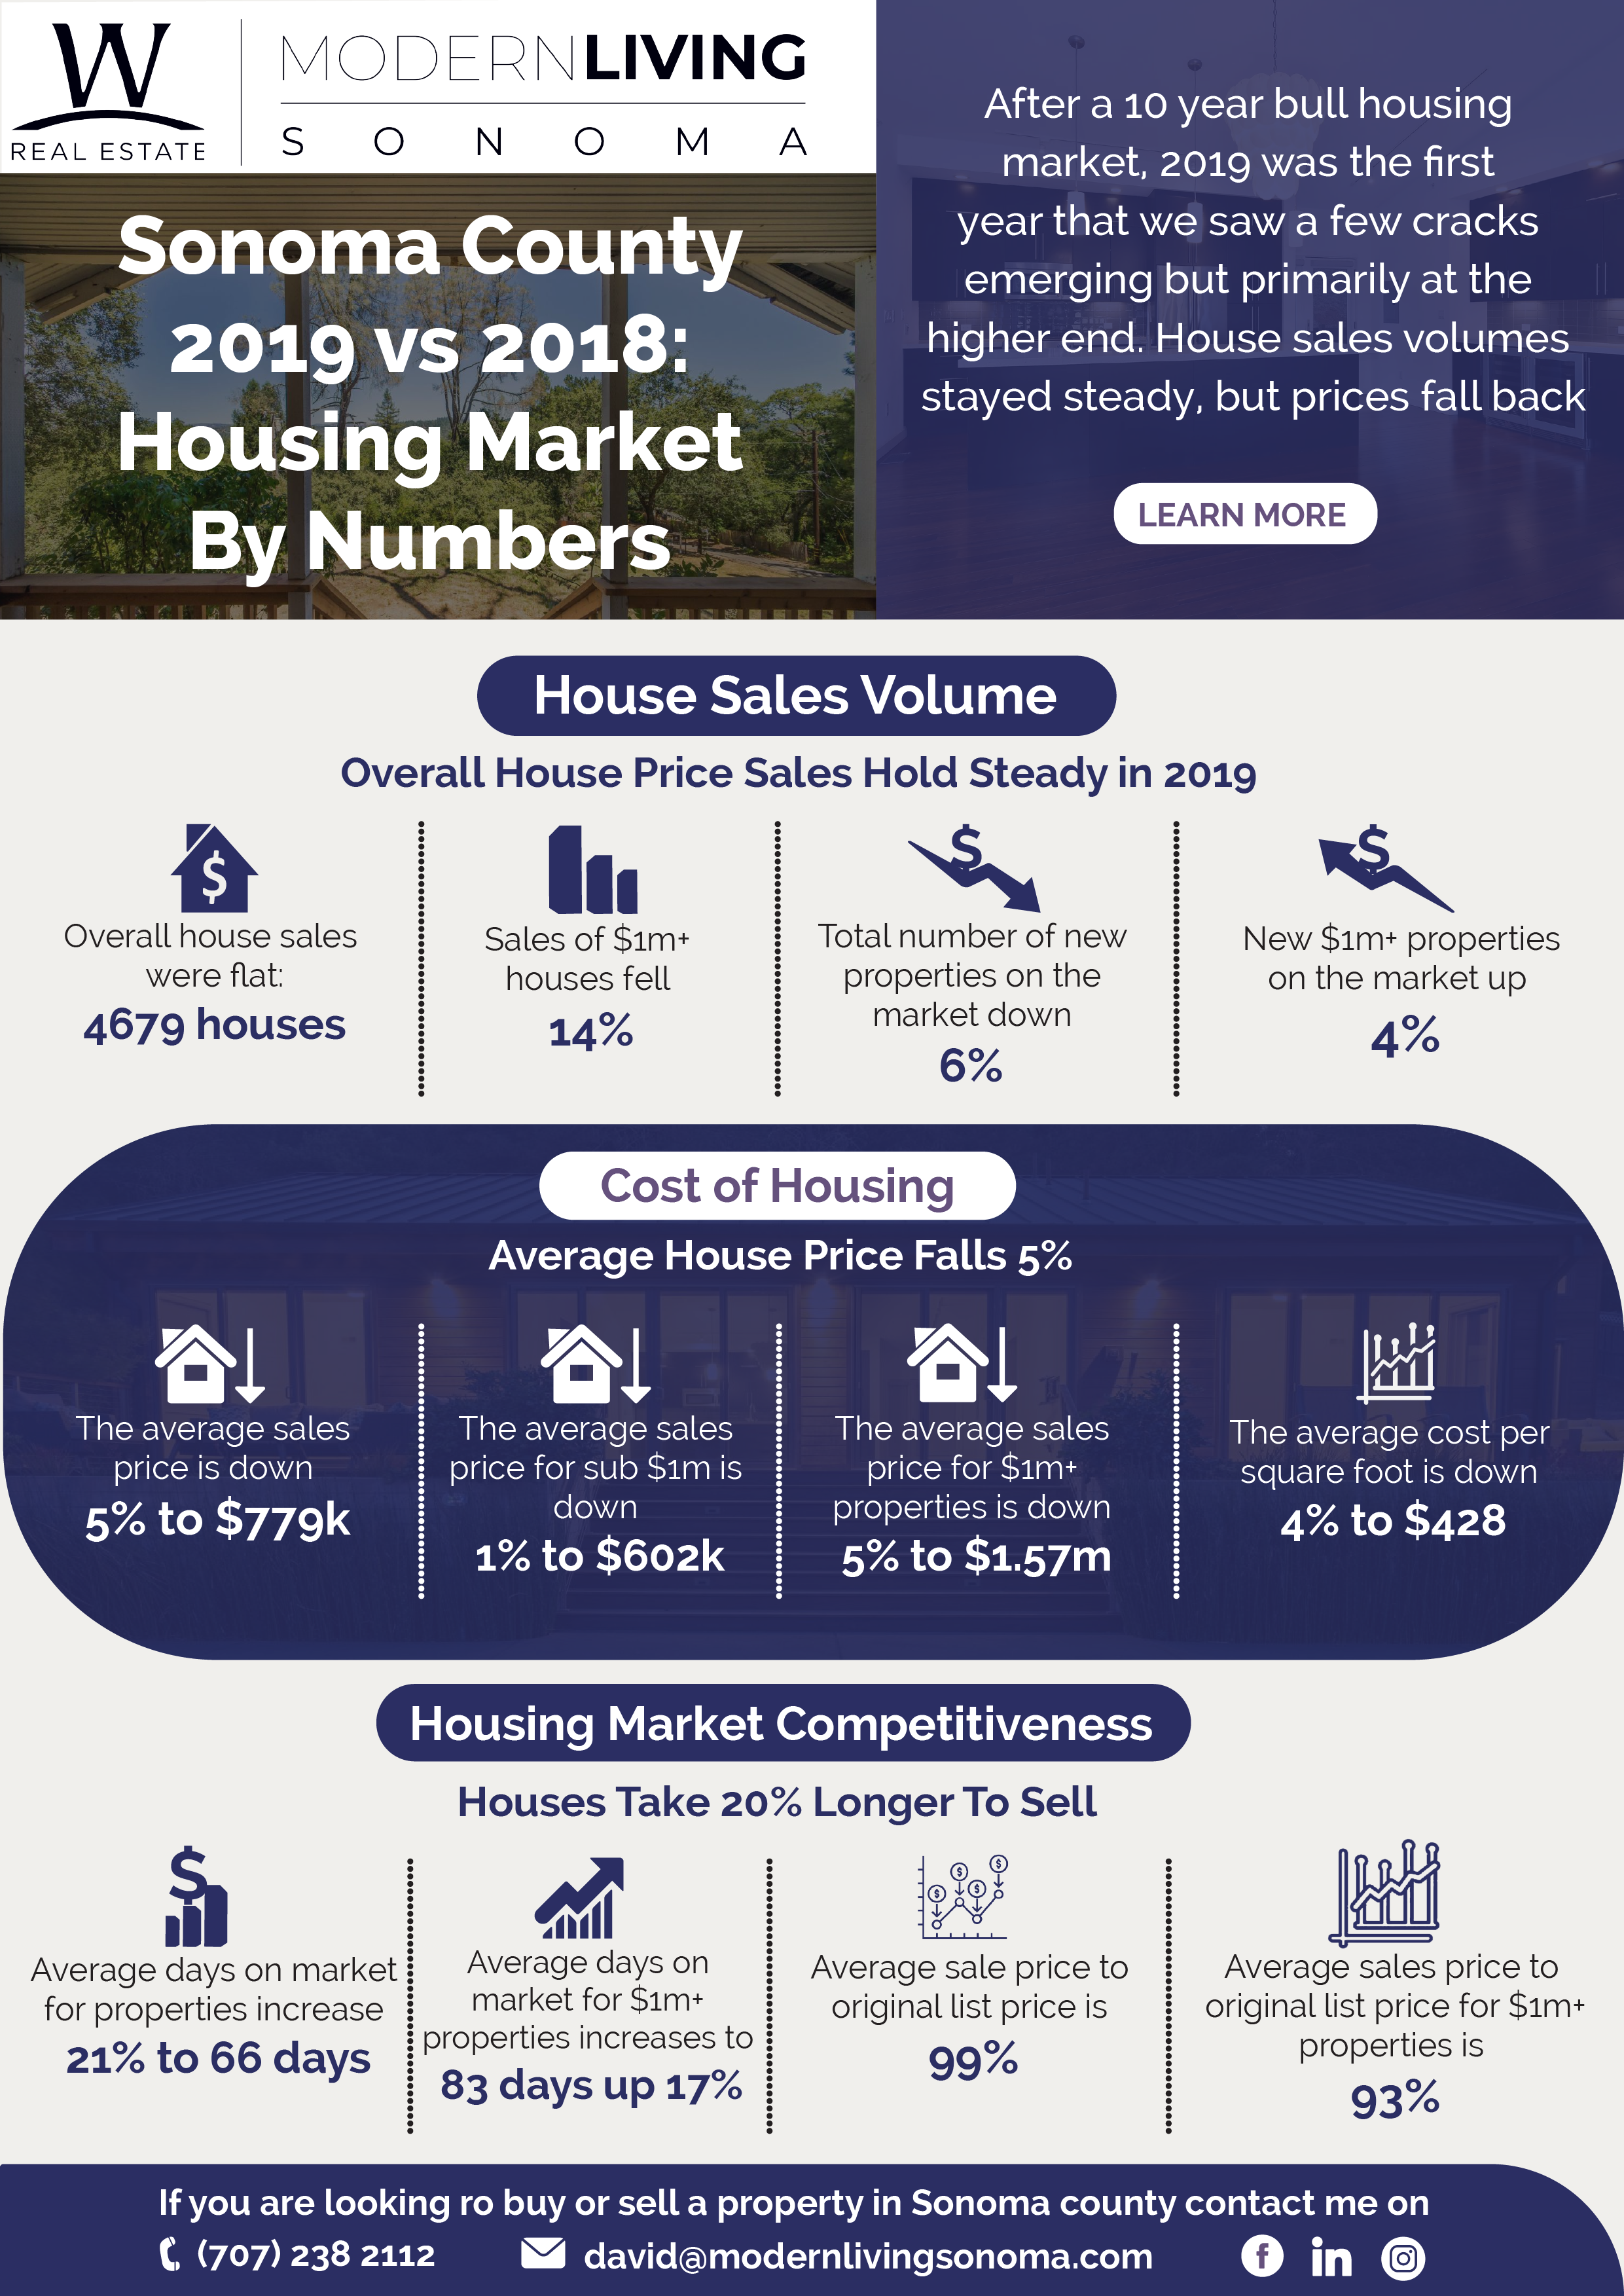
However, for the first time in a long time the property market stalled a little in 2019. The $1m+ property market definitely weakened, while the lower end of the market largely maintained its 2018 performance. To understand the full story, I analyzed all the data from house price sales across Sonoma County for 2019 versus 2018 looking at the key indicators: overall sales volume, the sale price to list price ratio, the average sale price of homes, the average price paid per square foot and the amount of time it takes to sell a property. So let’s take a look at each of these in turn for Sonoma County overall, the sub $1m market and then the luxury $1m+ market.


Sales Volumes

Overall the number of houses sold during 2019 when compared to 2018 was very similar although it did show a small fall of less than 1% to 5712 houses sold. However, if we look at the lower end and the luxury market separately, the stories are very different. Sales of properties for less than  $1m actually increased in 2019 by 2% up to 4015, whereas the sales of $1m+ properties actually fell by 14% year on year. Because the large sales volumes are at the low end, this sharp fall in the sales of luxury properties has not impacted the overall market volume too heavily.

What is interesting is that the number of new listings coming on the market was down by 6% overall but was up 4% at the top end of the market. My theory is that this is down to two factors: firstly, overall house price increases through a bull market means that year on year there are more properties that fall into the $1m+ category and secondly, because of this bull market, it has triggered a number of people with $1m+ properties to realize some of the their gains.

Sales Prices

This is the stat that everyone most cares about. Is my house worth more or less than last year. The answer is always, it depends on the property although there are clearly macro trends that all properties are subject to. The average house price has fallen 5% year on year from $737K to $779. However, looking at the data, it is the higher end of the market that has felt the biggest impact with properties selling for less than $1m falling by just 1% to $602k whereas higher end properties have fallen 5% down to an average of $1.57m. The higher end of the market has actually distorted the overall market because of some of the large falls at the top end.

House Price Competitiveness

There are two factors that indicate how competitive a market is and whether it is sellers or buyers who hold the cards. Firstly, how close are actual sale prices to list prices and secondly how long it typically takes to sell a property? What is interesting is that overall properties are still being sold for 99% of the list price. However, if we look at sales price against the original list price it is 97%. In other words most properties are being sold at a 3% discount to list price. In 2018 properties were being sold at asking price which represent 98% of the original list price. The big difference in 2019 is that we have seen a lot more price reductions prior to the sale. As with all of the data, it shows that the higher end has performed less well in 2019 with the average sale price to final list price being 97% and 93% when compared against the original list price.

Summary

Finally, does it take longer to sell a house in 2019 compared to 2018? The answer across the board is a strong ‘yes’ indicating a shift in the market towards the buyer through 2019. Overall properties are taking 21% longer to sell at 66 days. It is worth noting that this includes the escrow  period which will typically be 30 days, so in reality it means most properties are getting an offer accepted after 5 weeks. At the higher end of the market for properties over $1m, it is now taking on average 83 days to sell.

In Summary

2019 has seen the market weaken for the first time in many years with the higher end of the market being most badly impacted. This also means that for the first time in a long time, the balance of power has tipped towards the buyer. While history would expect the weaker high end market to trickle down across the entire market in 2020, with the core fundamentals still being strong this year may prove the exception. Through 2020, I would expect the market to continue along its current path with a weaker higher end market but the core market largely holding steady.

Print Details
Previous post
Next post
January Alternatives To Drinking Wine in Healdsburg
Have Insurance Costs In Sonoma County Increased After The Fires?

Office

MLS ##02076385Modern Living Sonoma
445 Center St, #G6Healdsburg
CA 95448
707 223 9589
david@modernlivingsonoma.com

Essentials

  • Home
  • About
  • What’s Your Home Worth
  • Blog
  • Newsletter Sign Up
  • Featured Listings
  • Recommendations
  • Featured Listings

Consumer Protection & Privacy

For ADA assistance, please email compliance@placester.com. If you experience difficulty in accessing any part of this website, email us, and we will work with you to provide the information.
inception-app-prod/ZDFmOWMzYTktNzU4Zi00YTIzLTk3MjYtYThkN2JkMGVlYzA3/logo/2019/01/WwithModern Living Sonoma_logo_white.png
inception-app-prod/YmI4ZWFlZWEtNjUyZC00NjRhLTlkNTgtY2M2MGUyYzEwNzRi/content/2020/05/melrose.svg

© 2022 All rights reserved

Created with Placester

Sign in

Sign In
Forgot your password?
Create an account
You have been successfully logged in
The page will reload automatically.
Go to the homepage
Sorry something went wrong
Login or password are incorrect. Please try again.
Try again

Sign Up

Sign Up
Already a User? Sign In
You have been successfully registered
Please check your email.
Go to the homepage
Sorry something went wrong
Please try again.
Try again

Reset password

Enter your email address

Reset password
Return to Log In
Reset password email has been sent.
Go to the homepage
Sorry something went wrong
Please try again.
Try again

Change password

Change password
Sign Up
Your password has been successfully reset.
Go to the homepage
Sorry something went wrong
Please try again.
Try again

Sign Up For Our Newsletter

Want to get the latest information about the Sonoma County housing market including vacation rental market, building a home or selling your home
Send
Succes! Your message was sent!
Back to homepage
Oops! Error occurred.
Please try again.
Back to form
Already a User? Sign In

Account verification in progress

Please wait...

Account Verified!
You may now log in into your account
Go to the homepage
Verify your email address
In order to log in to your account, you need to confirm your email address. Please check your inbox!
Go to the homepage

Share this listing

Copy Link