

Sonoma County's spring market got busier without getting more expensive. From March through May this year, closed sales rose in every single price segment compared with the same months in 2025, active inventory fell in every single price segment, and yet the median sold price stayed essentially flat across the board. More demand, less supply, and steady prices is an unusual combination, and it tells you a great deal about where this market actually sits as we head into summer.
Below is what the numbers show, broken out by price tier, with the charts that make each trend easy to see. All figures compare the spring months of March, April, and May this year against the same three months in 2025, using BAREIS MLS data.
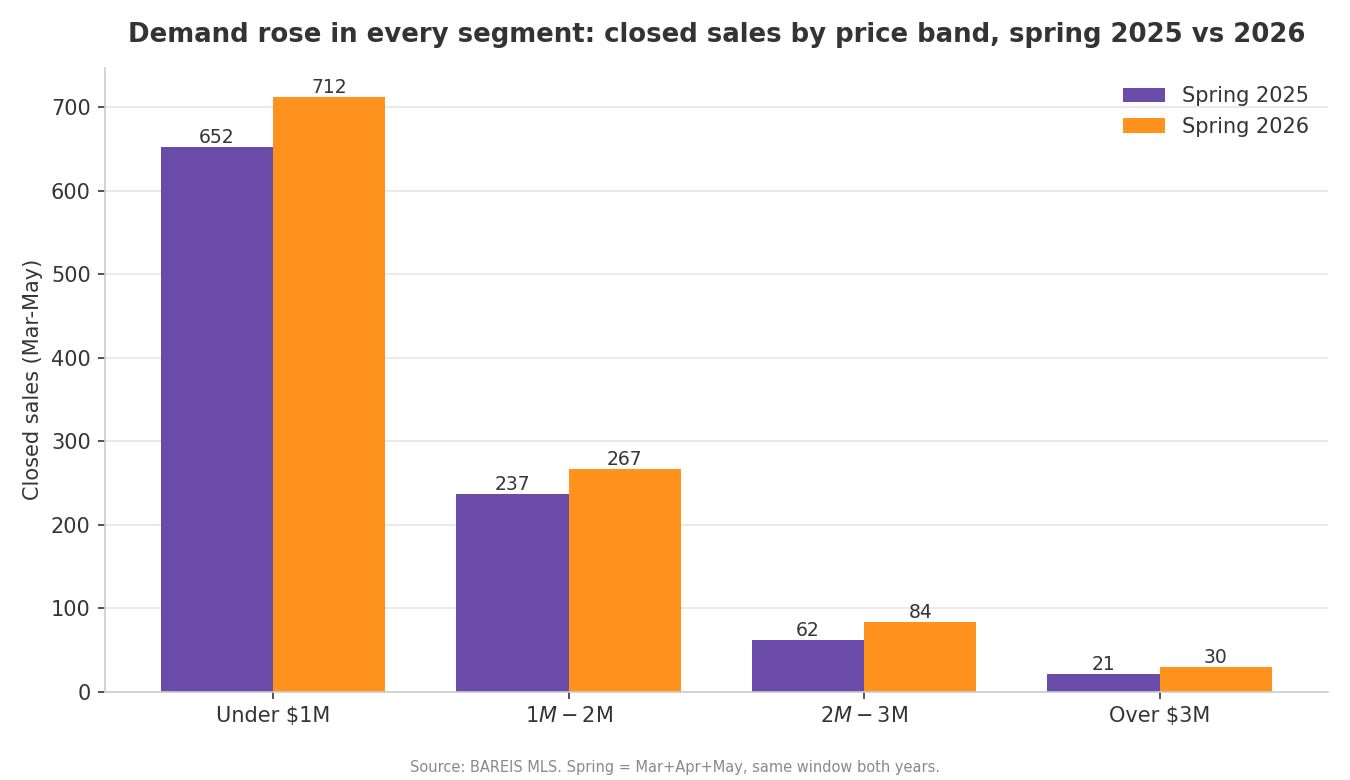
More homes sold, fewer on the market
Countywide, 1,063 homes closed between March and May, up 11.8% from 951 a year earlier. New listings actually slipped 2.2% over the same window, and the average number of active listings dropped 11.2%, from roughly 1,120 down to 995. Fewer homes came to market, fewer sat available, and more of them sold. Forward demand backs this up: the number of homes going under contract rose 6% year-over-year.
The supply squeeze was not isolated to one price band. It showed up everywhere, and it was deepest at the two ends of the market.
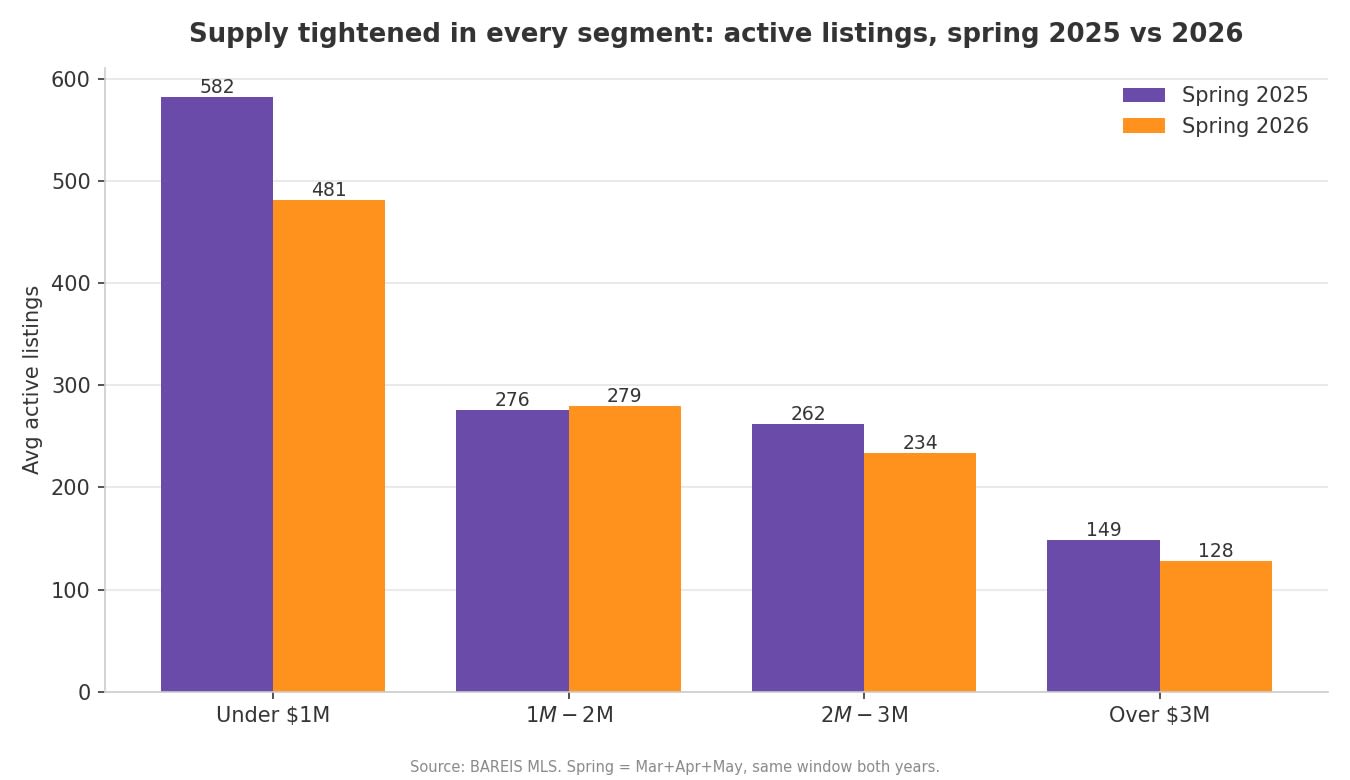
When supply falls across every tier like this, buyers lose the luxury of waiting for more options, and that is exactly what played out this spring.
The pace accelerated as the season warmed
The market did not just get tighter, it got faster. Countywide closed sales ran about 211 a month through the slow January and February stretch, then jumped to 354 a month across the spring, a 68% surge as buyers came off the sidelines. The higher the price tier, the steeper that rebound: sales in the $1M to $2M band more than doubled from the winter pace, the $2M to $3M band rose about 133%, and the over $3M tier jumped roughly 186% from its winter trough.
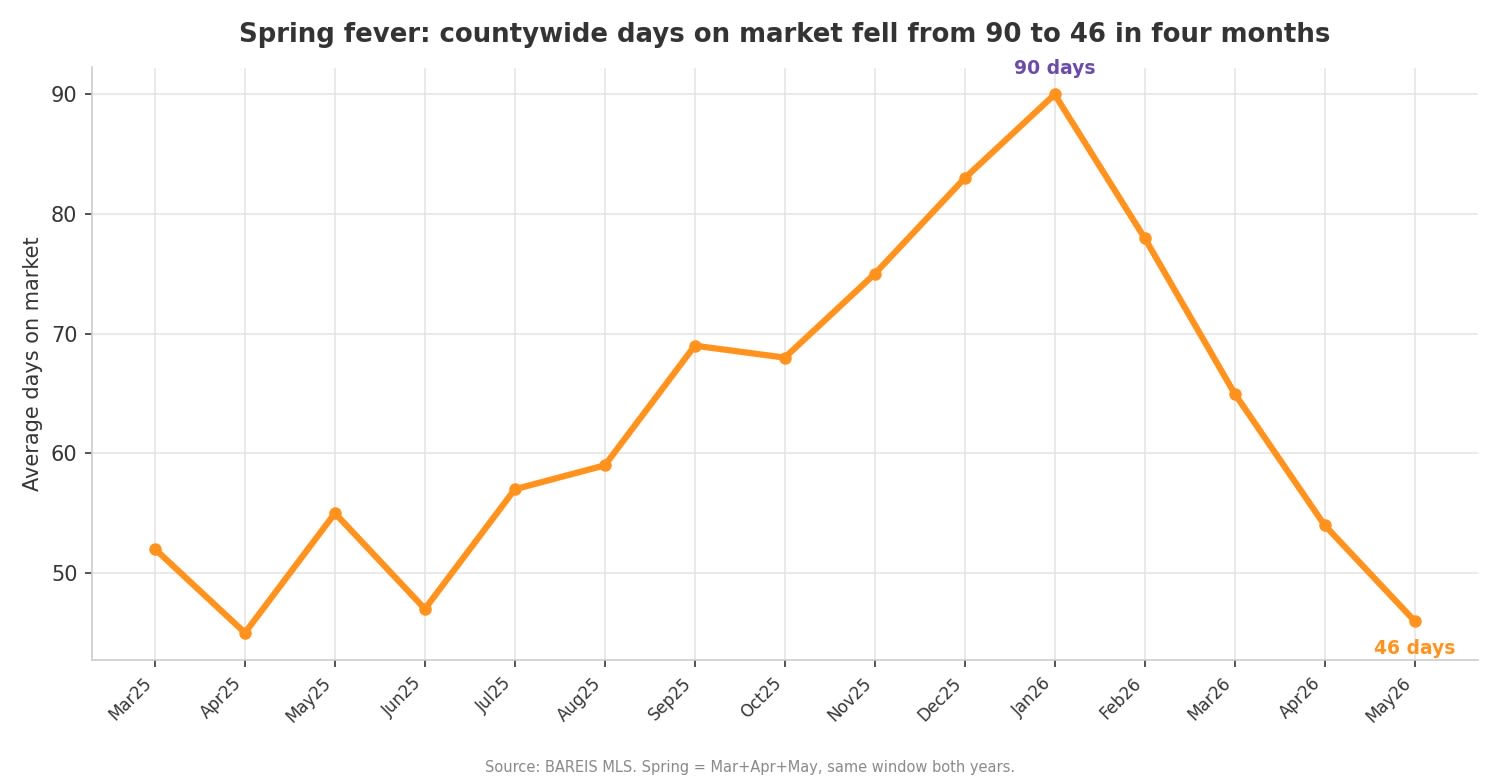
Days on market tells the same story from another angle. The typical Sonoma County home took 90 days to sell in January. By May that had fallen to 46, the fastest stretch in more than a year of data.
Prices stayed flat in every segment
Here is the part that surprises people. With demand up and supply down, you would expect prices to climb. They didn't. The countywide median sold price barely moved, down 0.2% year-over-year to about $813,000. Break it out by segment and the pattern holds: homes under $1M were down 0.9% to roughly $712,000, the $1M to $2M band was up 0.4% to about $1.295 million, and the $2M to $3M band was effectively flat near $2.6 million. The over $3M median reads lower year-over-year, but with only about 30 sales that figure swings on which specific estates happen to close, not on any real softening.
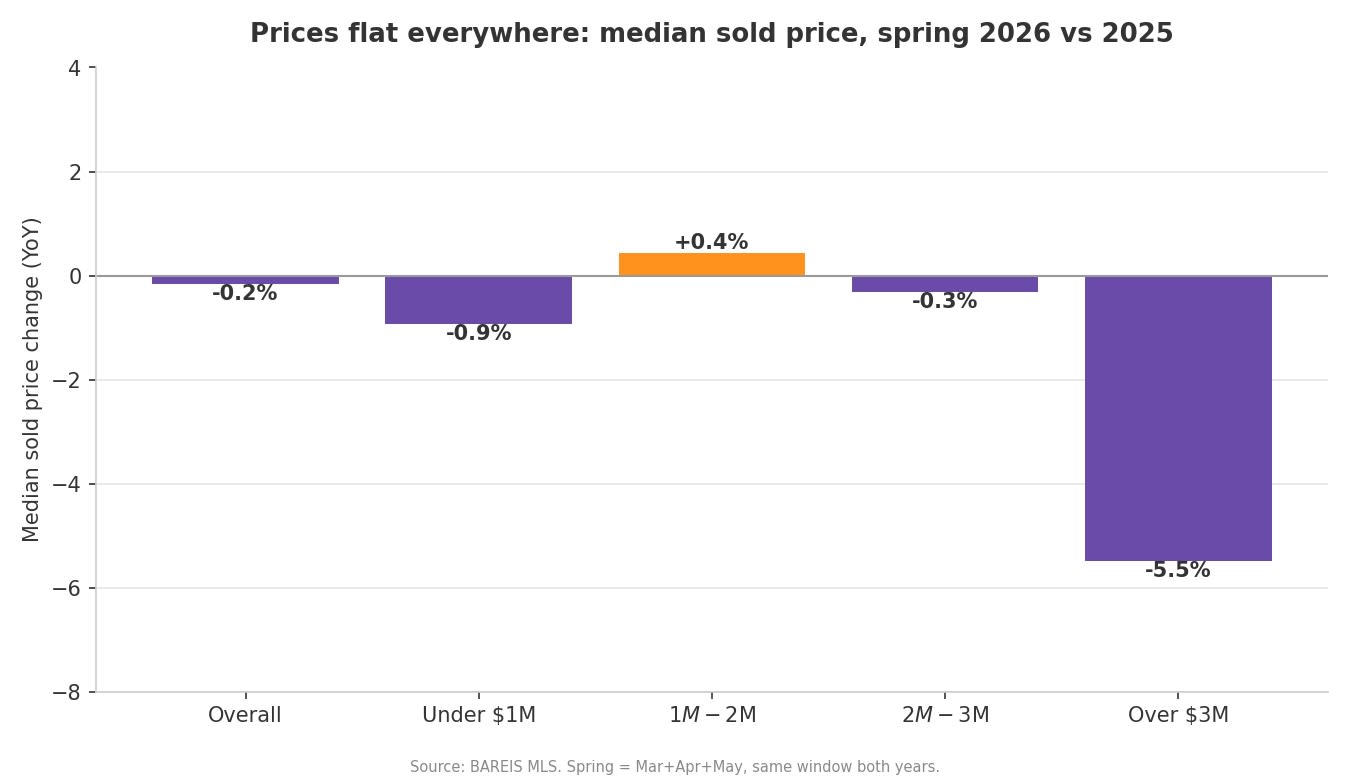
So this spring is a story about volume and speed, not price growth. This also tracks with the wider national picture, where prices softened this spring rather than rising. The difference locally is that well-priced homes are still selling quickly and close to asking. The sold-to-original-list ratio held at about 96% countywide and 98% under $1M, which means buyers are showing up and paying fair value whenever a home is priced correctly from the start.
How hot is each segment, really
Absorption rate is the cleanest read on market temperature, because it measures the share of available homes that sell each month. Above 25% leans toward a seller's market, above 35% is a strong seller's market, and below 15% favors buyers. The county overall sat at 35.7% this spring, up from 28.4% a year ago. But the average hides a wide spread between the affordable end and the luxury end.
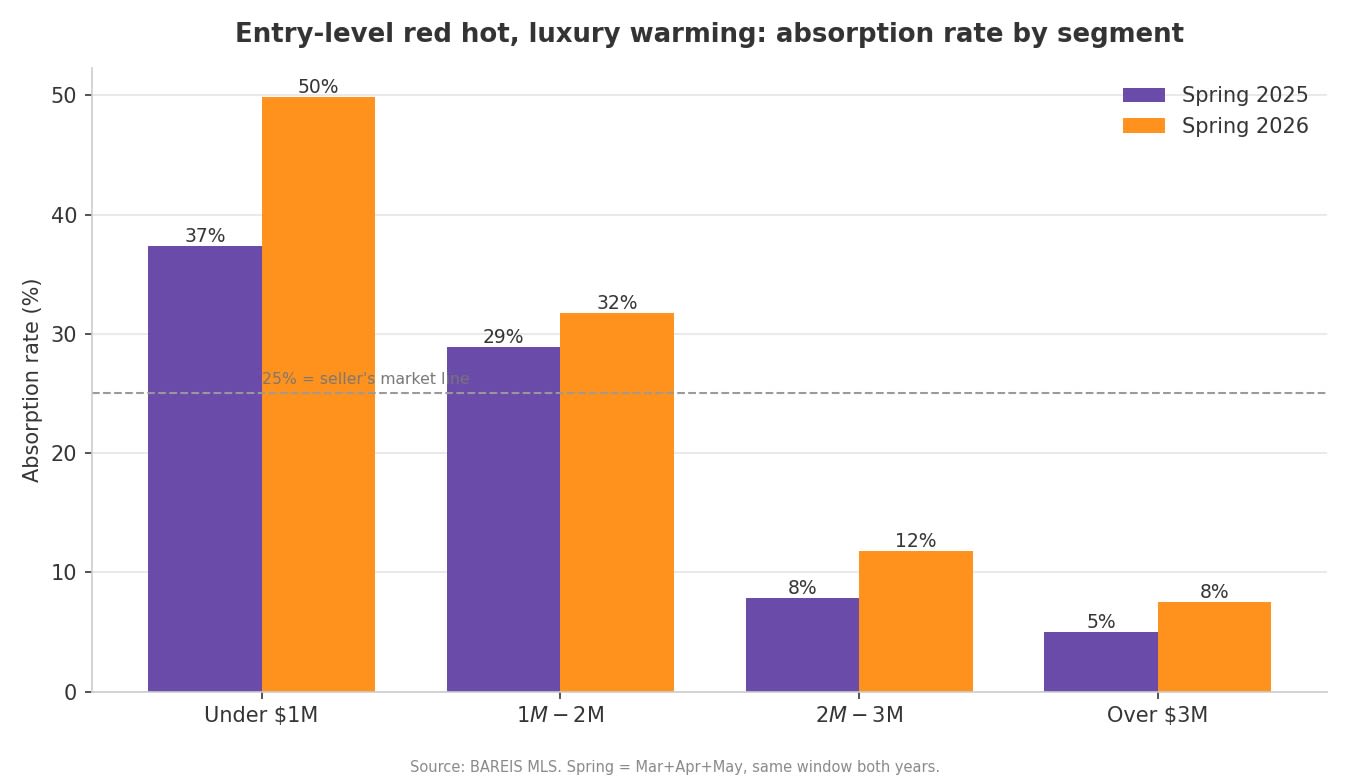
The under $1M segment is the engine of the county. Its absorption rate hit 49.8% this spring, up from 37.4%, meaning roughly half of all available sub-$1M homes are selling every month. Inventory there fell the hardest of any segment, down 17.2%, while sales rose 9.2% and homes sold in about 50 days at 98% of original list. For anyone shopping under a million dollars, this is a fast, competitive, but still fairly priced part of the market.
The luxury market woke up
The most dramatic movement happened at the top. Sales in the $2M to $3M band rose 35.5%, from 62 closings last spring to 84 this spring. Above $3M, sales rose 42.9%, from 21 to 30, and homes going under contract jumped 44%, the strongest forward-demand signal anywhere in the county.
Luxury sellers are also negotiating from a stronger position than a year ago. Over $3M, the sold-to-original-list ratio improved from 86.7% to 91.7%, and the average time to sell fell from 108 days to 84, a full month faster. Both luxury tiers still lean toward buyers on absorption in absolute terms, sitting in the 8% to 12% range against the under $1M tier's 50%, so prepared high-end buyers retain real leverage even as that window narrows. If you want a sense of where this activity is concentrated, our guide to the luxury neighborhoods in Sonoma County maps out the areas drawing the most high-end interest. For the wider view of how the county's price tiers move differently over a longer horizon, our look at Sonoma County's 2025 housing market is a useful companion to this update.
What this means if you're buying
The under $1M tier is the best value play right now. It is the fastest-moving segment in the county, yet its median price is flat to slightly down, so you are not racing rising prices. Inventory is shrinking in every band, though, so waiting for more choice has generally worked against buyers this spring. If you are shopping above $2M, you still hold some leverage on paper, since absorption there remains well below the countywide average, but the falling days-on-market numbers say that advantage is fading. Across every tier, the homes that sell fastest are the ones priced accurately, so move decisively when you find the right one.
What this means if you're selling
Conditions favor you, but rising demand is not a license to overprice. Median prices are flat in every segment, so accurate pricing from day one is what actually moves a home. The data is blunt about it: priced right, homes are selling in roughly 45 to 55 days; priced high, they sit. The high end has genuine momentum, with $2M-plus sales up 35 to 43% and luxury homes selling a month faster than last year, so if you have been waiting for the right window to list a higher-priced property, the spring numbers say it is open. You can see what is actively selling on our current listings page.
Have questions about buying or selling in Sonoma County this year? Email me directly at david@bruingtonhargreaves.com and I am happy to walk you through what these numbers mean for your specific town and price range.
About the Author
David Hargreaves is the co-founder of BruingtonHargreaves, one of Sonoma County's top-ranked real estate teams and part of W Real Estate. Originally from the UK and an Oxford University graduate, David built and ran a digital marketing agency serving Google, Facebook, and other major brands before becoming one of Sonoma County's top agents within three years of entering real estate.
Today he and business partner Jonathan Bruington have sold more than $250 million in Sonoma County homes over the past three years, earning recognition as a RealTrends No. 2 team in the county and the No. 1 team in Healdsburg. David specialises in helping Bay Area buyers and sellers with luxury properties and vacation rentals across Healdsburg, Windsor, Santa Rosa, and the Russian River communities.
He lives in Sonoma County with his wife Nancy and is happiest cycling the back roads, exploring local wineries, or behind a camera. Have a question about buying, selling, or building in Wine Country? Book a free call.