


It feels like the market has taken a deep breath over the past few weeks but while there are definitely more price reductions, there are still a lot of properties getting multiple offers.
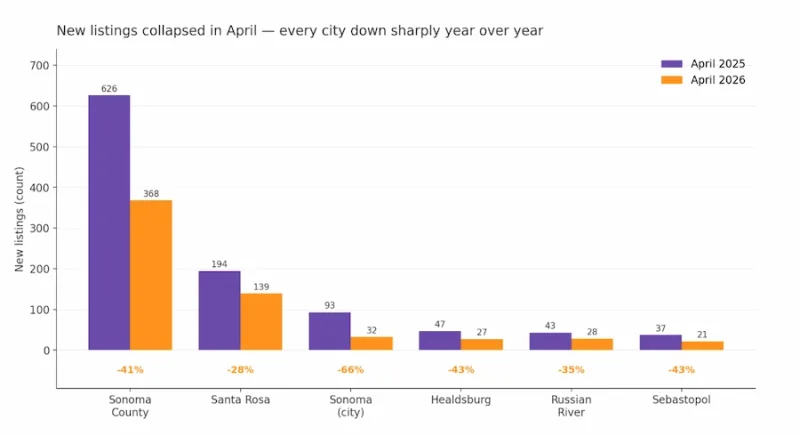
New listings of single-family homes in Sonoma County fell 41.2% in April 2026 compared to April 2025, the steepest monthly shortfall in our local MLS data in over a year. April should be the busiest listing month of the year. Instead, it was the lightest April for new supply we have on record, and the deficit has been getting worse every month.
The numbers come from a county-wide pull of BAREIS MLS data covering single-family homes in every BruingtonHargreaves coverage area: Santa Rosa, Healdsburg, Sebastopol, Sonoma, and the Russian River communities. We broke the data down two ways: by city and by price segment, with the segment split set at $1 million. The Russian River, where almost no inventory clears the $1M line, was kept as a single bucket. The full chart pack lives at the bottom of this post.
The single most useful way to read this market is by looking at how the year-over-year change has moved each month this spring.
February 2026 new listings: down 6.6% from February 2025
March 2026 new listings: down 11.0% from March 2025
April 2026 new listings: down 41.2% from April 2025
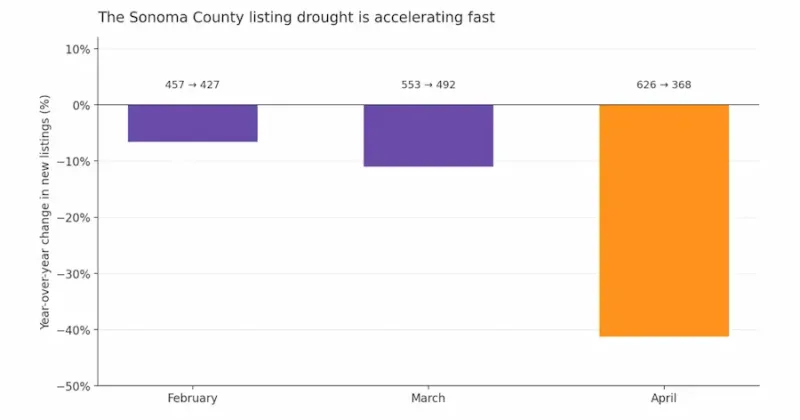
The drop is not a one-month blip. It is a trajectory, and the slope is steepening. In April 2025, the BAREIS MLS recorded 626 new single-family listings across Sonoma County. In April 2026, it recorded 368. That is the lowest non-deep-winter reading in 15 months of data, lower than every month of the prior summer, and lower even than January 2026 (which had 402 new listings — January, the slowest month of any normal year).
For buyers, this means the pool of options coming on the market each week is materially smaller than it was a year ago. For sellers, it means fewer competitors on the same MLS page.
It would be tempting to assume this is just a national rates-and-affordability story rippling through Sonoma County. It is not. According to Realtor.com data published by the Federal Reserve Bank of St. Louis, US new listings in April 2026 were up about 1% year over year. California new listings were down about 5% year over year. Sonoma County, on Realtor.com's broader methodology that includes condos, townhomes, and multi-feed listings, was down 5.6%.
The deeper drop we see in our BAREIS data reflects a tighter slice of the market: single-family homes inside the BAREIS feed, which is the slice almost every move-up, downsize, or relocation buyer is actually shopping. That slice is contracting much faster than the broader county, the state, or the country.
What that means in plain English: this is a local single-family supply story, not a national one. Whatever is keeping Sonoma County homeowners off the market right now — locked-in mortgages, insurance uncertainty, Prop 13 and Prop 19 dynamics, or simply waiting for a clearer signal on rates — is doing it harder here than in most of California, and far harder than in the country at large.
The $1M line divides Sonoma County into two different markets, and both of them are short on supply. Entry-level inventory (under $1M) fell 39.3% in April year over year — from 387 new listings to 235. Luxury inventory (over $1M) fell 44.4% — from 239 new listings to 133.
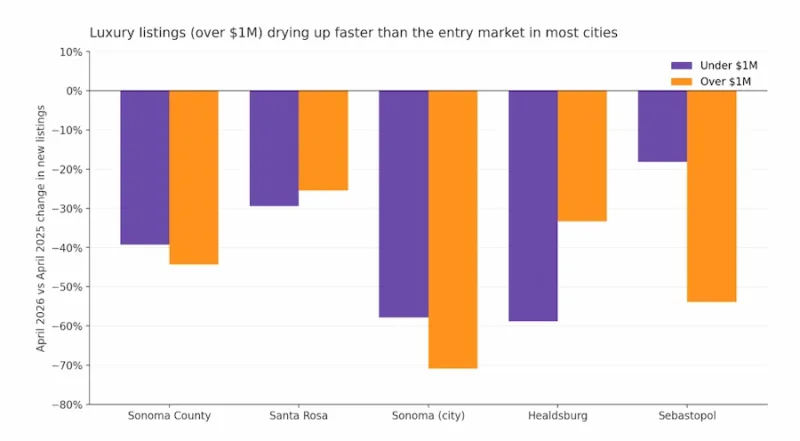
So the luxury market is tightening slightly faster than the entry market in aggregate, but the segment story changes dramatically when you zoom in by city.
Santa Rosa is the most resilient market in the county on supply. April new listings fell 28.4% (from 194 to 139), the smallest drop of any city we tracked. Both the under-$1M (-29.5%) and over-$1M (-25.5%) segments are tightening at roughly the same pace. If you are shopping for a Santa Rosa home and feel like there are slightly fewer options each weekend, you are right — but the contraction is meaningfully gentler here than in the rest of the county.
Healdsburg shows an unusual pattern. The luxury segment (-33.3%) is holding up better than entry level (-58.8%). Just 7 new homes under $1M came onto the market in Healdsburg in all of April. That is the tightest entry-level supply in the county on a percentage basis. If you have been waiting for a Healdsburg starter home or second-home pied-à-terre to surface, the math is working against you
Sebastopol is the most split market in the county. Its luxury segment fell 53.8% in April year over year, the steepest luxury drop outside Sonoma the city. But its under-$1M segment actually grew on a three-month rolling basis — up 13.0% versus the same window in 2025. Sebastopol is the only city in our dataset with a positive year-over-year reading anywhere in the data.
Sonoma (the city, not the county) had the most dramatic April. New listings across all prices fell 65.6% — from 93 to 32. Its luxury market (over $1M) was the steepest decline in the entire dataset at -70.9% (55 listings down to 16). Some of that is a tough comparison: April 2025 was an unusually big listing month for Sonoma. But the absolute April 2026 number (32) is lower than every month of 2025 except December.
Russian River — which we look at as a single price band because almost everything trades under $1M — saw new listings fall 34.9% in April year over year. That is roughly in line with the countywide pattern, slightly less severe.
The shape of the market right now favours patient, prepared buyers. Choice is tightening, not loosening. Anyone waiting for a meaningful jump in spring inventory should reset that expectation: the jump did not happen, and the underlying trend is heading the wrong direction.
Entry-level shoppers face the toughest math. Across the county, sub-$1M single-family listings are down nearly 40% on the month. In Healdsburg specifically, the number is closer to 59%, with barely a handful of homes hitting the market each month.
The most resilient hunting ground is Santa Rosa, where supply is still contracting but the gap is the smallest. Sebastopol's entry segment is the rare bright spot — slightly more new under-$1M inventory in the spring window than a year ago.
The competition for buyer attention is the lowest it has been in a year. Sellers who list now are stepping into an MLS with materially fewer rivals than the same week in 2025. The over-$1M segments in Sonoma the city and Sebastopol have seen the steepest declines in new listings — both down more than 50% year over year — which means the few luxury homes that do go live are walking into an audience that has almost nothing else to compare them against.
That dynamic shows up in pricing power eventually, not immediately. But a sustained, accelerating 40%+ supply deficit tends to translate into firmer pricing if buyer demand even stays flat — and pending sales in Sonoma County have been holding up across the same window.
We pulled new listings counts from BAREIS MLS for the key markets we cover, split each city into under-$1M and over-$1M buckets, and computed three comparisons:
April 2026 vs April 2025 (single-month year-over-year)
Feb-Apr 2026 vs Feb-Apr 2025 (three-month spring window)
The monthly trajectory across all 15 months from February 2025 through April 2026
Then we cross-checked the Sonoma County total against the Realtor.com / FRED national, state, and county series to make sure the local story stood up against the broader market.
The full chart pack and underlying numbers are available on request. If you want a tailored read on what this means for your specific neighbourhood, price range, or timeline — whether you are buying, selling, or just paying attention from the Bay Area — get in touch. You can also browse our current listings or read our 2025 Sonoma County market report for the longer-arc view, and our take on the best cities in Sonoma County for buyers weighing where to start.
Have questions about your specific neighbourhood or price range? We track this data every week — happy to share a tailored read for your situation. Book a free call.
Find out why we love living here
The Sonoma Life: A New Chapter of Living in Wine Country
Imagine leaving behind the constant buzz of city life for a place where the pace slows down just enough to appreciate life's finer moments. Where morning fog gives way to sun-drenched afternoons, and your evening commute might involve a scenic drive past rolling vineyards instead of gridlocked highways. This is the reality for those who choose to make Sonoma County their home.
For the first time since 2020, California is experiencing a net positive migration, with Sonoma County emerging as a particularly attractive destination. The reasons are as diverse as the landscape itself – from the dramatic Pacific coastline to the inland valleys dotted with world-class wineries.
Sign in with your email address
Enter your email address


