Sonoma County recorded 263 closed residential transactions in March 2026 across 21 cities. The headline number: 33.8% of homes sold over asking price, and nearly 39% attracted multiple offers. But those countywide averages mask dramatically different conditions depending on where you're buying and how much you're spending.
We ran every transaction through a full analysis — financing type, offer competition, sale-price-to-list-price ratios, and price band breakdowns. Here's what the data actually says.
Cash buyers are concentrated in lifestyle markets
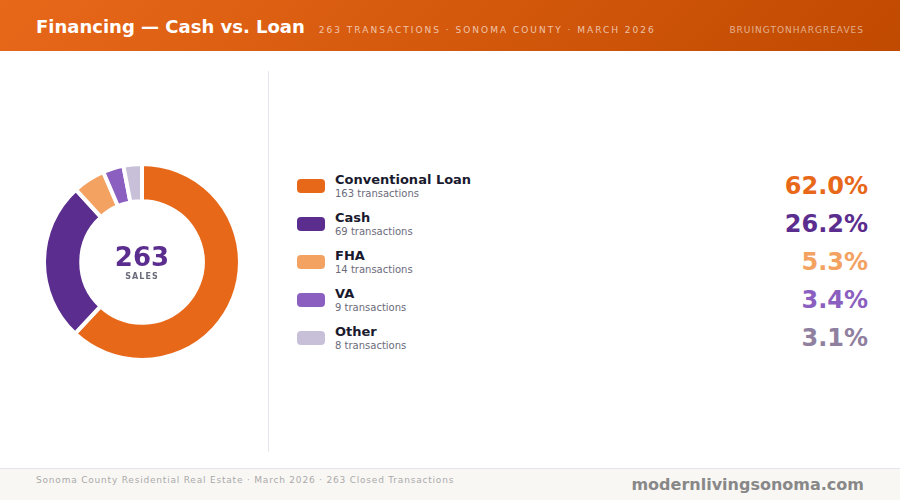
Across all 263 sales, 73.8% were financed with a loan and 26.2% were cash purchases. Conventional loans dominated at 62% of all transactions, with FHA and VA together making up about 8%.
But cash activity varies wildly by city. Resort and second-home markets see the highest cash rates: Glen Ellen (75%), Bodega Bay (66.7%), and The Sea Ranch (62.5%). Among larger-volume cities, Sonoma led cash activity at 34.8%, followed by Petaluma at 31.0%. Santa Rosa — the county's highest-volume market with 96 transactions — was the most loan-dependent at just 16.7% cash.
For buyers competing in Santa Rosa or Rohnert Park, this means loan-financed offers are the norm and won't put you at a disadvantage. In Sonoma County's top-ranked cities like Healdsburg (23.5% cash) and Sonoma (34.8%), you're more likely to face a cash buyer across the table.
The most competitive cities aren't the most expensive
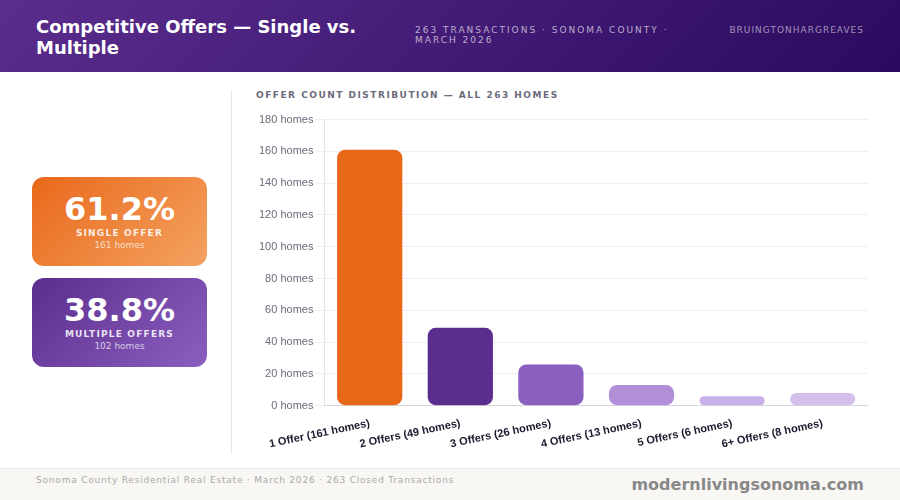
Nearly 39% of all homes attracted multiple offers in March, but the most competitive cities aren't the luxury markets — they're the mid-price, primary-residence towns where inventory pressure is tightest.
Cloverdale led with 57.1% of homes receiving multiple offers, followed by Windsor at 53.8%, Sebastopol at 50.0%, Petaluma at 48.3%, and Rohnert Park at 48.0%. These are communities where working families and downsizers are actively competing for a limited pool of homes.
Meanwhile, Guerneville, Bodega Bay, and The Sea Ranch saw very few multiple-offer situations. Lifestyle and vacation-home markets move at a slower pace, and buyers there tend to be more deliberate.
Multiple offers push prices up by 5.7 percentage points
The average sale-price-to-list-price ratio (SP%LP) for homes with multiple offers was 101.2%, compared to 95.6% for single-offer homes — a 5.7 percentage point premium. The correlation between offer count and SP%LP was r = 0.30 (p < 0.0001), which is statistically significant: more offers reliably push final prices higher.
Windsor posted the highest average SP%LP among major cities at 102.9%, followed by Petaluma at 101.7%. At the other end, The Sea Ranch averaged 89.9% and Bodega Bay 87.5% — coastal markets where buyers have more leverage to negotiate below asking.
The $900K to $1.1M range is the tightest segment
Price band analysis reveals a clear sweet spot for competition. The $900K–$1.1M range is the most heated segment in Sonoma County right now: 58.1% of homes in this band sold over asking, 45.2% received multiple offers, and the average SP%LP exceeded 100%.
The $500K–$700K and $700K–$900K bands are also competitive, with over-asking rates around 37–40% and multiple-offer rates above 41%.
The luxury tier ($1.5M+) tells a different story. Only 8.9% of homes above $1.5M sold over asking, and multiple-offer rates dropped to 26.7%. Buyers in the upper market have considerably more negotiating power — a pattern consistent with what we documented in our 2025 housing market report.
What this means for buyers and sellers
If you're buying in the $700K–$1.1M range in Windsor, Petaluma, or Rohnert Park, expect competition. Come prepared with a strong offer strategy and pre-approval in hand. If you're buying above $1.5M or in a coastal/lifestyle market, you have room to negotiate.
If you're selling in one of those competitive mid-range markets, pricing strategy matters enormously. Homes that attract multiple offers sell for 5.7% more than those that don't. A well-priced home in the right market can generate a bidding war — and the data shows that bidding war translates directly into a higher sale price.
For a closer look at how different Sonoma County cities fit your lifestyle and budget, we break down each community in detail.
Have questions about what March's data means for your specific situation? We're always happy to walk through the numbers.
CTA
Have questions about what March's data means for your specific situation? We're always happy to walk through the numbers. Alternatively you can make an appointment to chat with us


