
How much does a house cost in Healdsburg? What is the most expensive home? What is the cheapest home? This blog highlights the best and worst properties sold in Healdsburg in 2022


Every month I sit down with the raw transaction data from across Sonoma County and look for patterns. Not headlines. Not spin. Patterns. Because the difference between a good real estate decision and a great one often comes down to understanding what the numbers are actually saying — not what someone with a vested interest in your decision wants you to hear.
This December, I analyzed 275 residential transactions across Sonoma County. What emerged was a picture of a market operating in multiple gears simultaneously, depending on where you're looking and what price point you're playing in. If you're considering buying, selling, or investing here, this analysis is for you.
Before we dive into the detail, here's what those 275 transactions revealed across five key metrics:
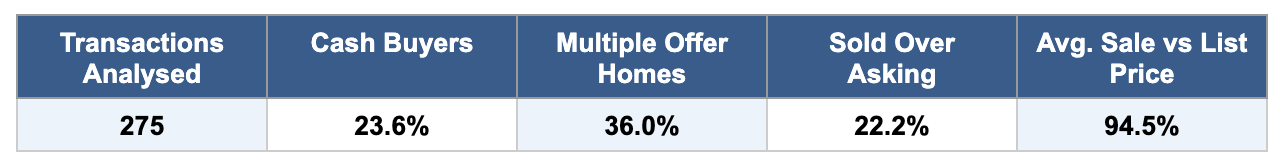
Five numbers that tell a layered story. Nearly one in four buyers is paying cash. More than a third of homes are attracting competing bids. And yet the average home is still selling at 5.5% below its asking price. That gap between competition and outcome is exactly where the real insight lies — and it's what we're going to unpack below.
Of the 275 homes sold in December, 65 were cash transactions — a rate of 23.6%, broadly in line with the national average. But break that down by city and the story becomes much more interesting.
The lifestyle and luxury markets of Sonoma County attract a disproportionate share of cash buyers. Glen Ellen hit 50%. Sonoma came in at 40.6% — nearly double the county average. These aren't coincidences. They reflect a buyer profile that is wealthy, often relocating from the Bay Area, and motivated by lifestyle rather than necessity.
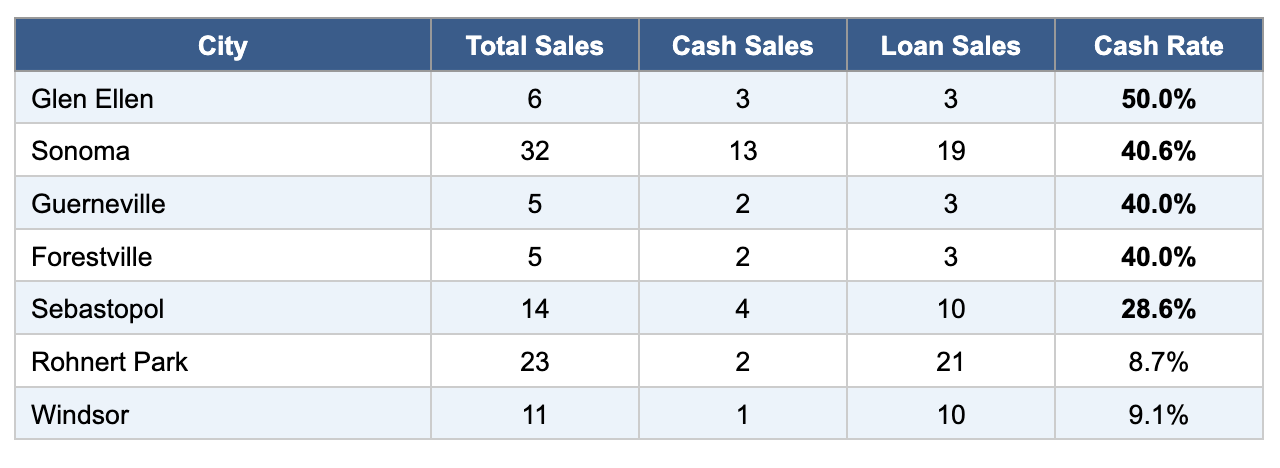
Contrast those numbers with Rohnert Park (8.7% cash) and Windsor (9.1%) — family-oriented, commuter-friendly markets where buyers are overwhelmingly relying on financing. These are first-time buyers and move-up families, stretching to make the numbers work with a mortgage. Two very different Sonoma Counties, operating side by side.
What does a high cash rate mean for you as a buyer or investor? It's a proxy for buyer quality and long-term conviction. When 40% of buyers in Sonoma are paying all-cash, the people competing with you for those properties have deep resources and patient time horizons. That kind of buyer supports prices and reduces the risk of a sharp correction — wealthy lifestyle buyers don't panic-sell when the market softens.
36% of homes in December attracted multiple offers. But here's something that surprises many people: the most competitive bidding wars in Sonoma County are not happening in the luxury wine country segment. They're happening in the affordable suburbs.
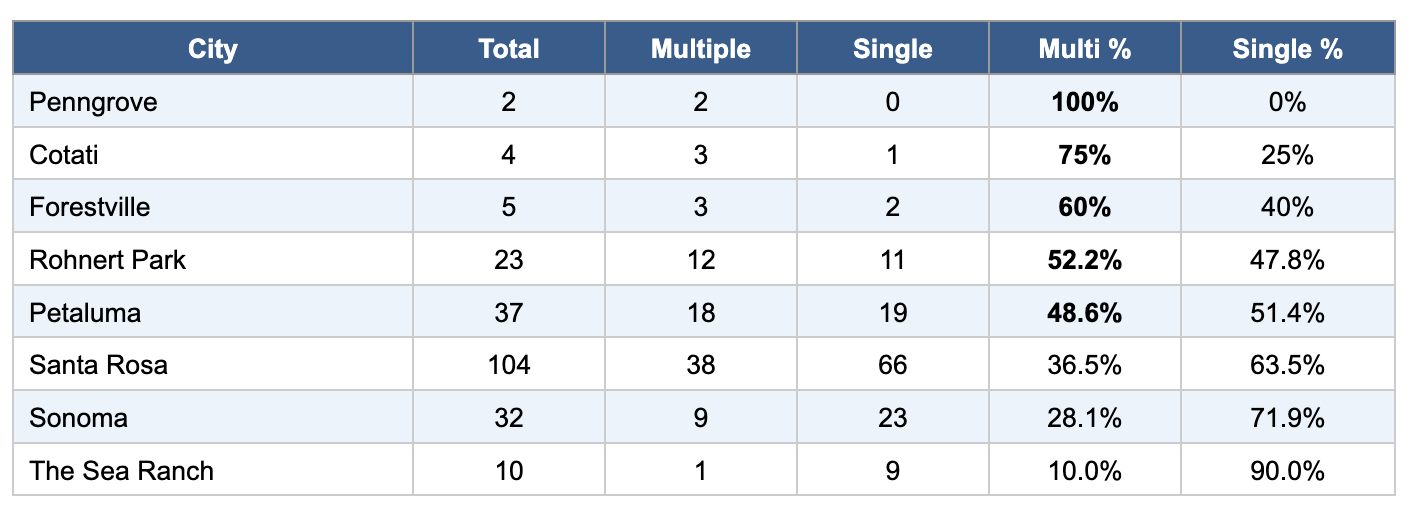
For the lifestyle investor eyeing Sonoma or The Sea Ranch, the picture is different. Only 28% of Sonoma homes and a mere 10% of Sea Ranch properties attracted multiple offers. This reflects both higher price points that narrow the buyer pool and the more deliberate nature of lifestyle purchases. These buyers are choosing to buy, not scrambling to get in before they're priced out. That means they'll walk away from anything that feels overpriced.
The practical takeaway: if you're buying in Sonoma or Healdsburg as a second home or investment property, you generally have more negotiating room and more time to make a thoughtful decision. That's a luxury not available to buyers in Rohnert Park or Petaluma right now.
The average Sonoma County home sold for 94.5% of its asking price in December. Put another way: if a home was listed at $900,000, it closed at around $850,500 on average. That 5.5% gap is real money, and it varies significantly by price point.
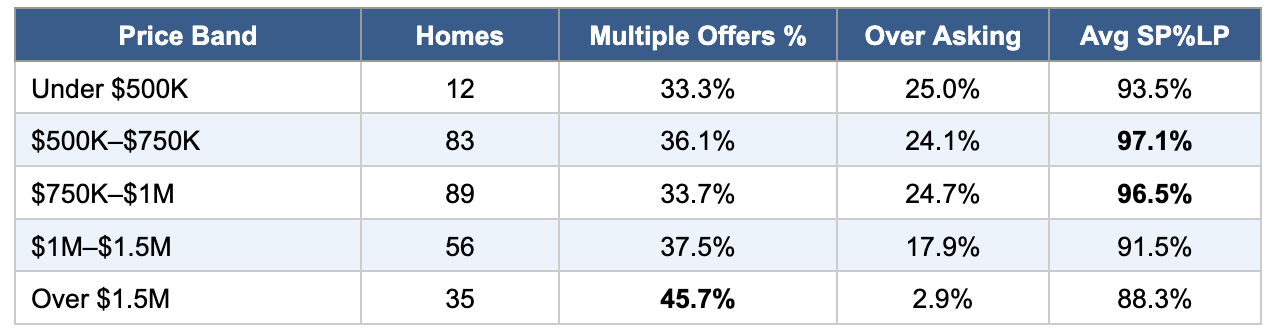
The mid-market sweet spot — homes priced between $500K and $1M — is delivering the best outcomes for sellers, with sale-to-list ratios of 96.5% to 97.1%. Demand is broadest here, the buyer pool deepest, and competition most meaningful.
The luxury segment above $1.5M tells a genuinely counterintuitive story. It has the highest multiple-offer rate of any price band at 45.7%, yet simultaneously the worst sale-to-list performance at 88.3%, with only 2.9% of homes selling over asking. How do we make sense of this?
Multiple offers in the luxury space are not the same as bidding wars in Rohnert Park. Sophisticated high-net-worth buyers will compete for the right property, but they negotiate hard on price. They're not going to overpay out of fear. For luxury sellers, the message is clear: don't be seduced by interest from multiple parties into thinking you can push your price. Right-pricing from day one is everything.
One of the most interesting findings in this dataset is what happens to cash buyer behaviour across price points. Rather than a simple pattern where more expensive properties attract more cash buyers, the data reveals a U-shaped curve — with elevated cash rates at both the top and bottom of the market, and a noticeable dip in the middle.
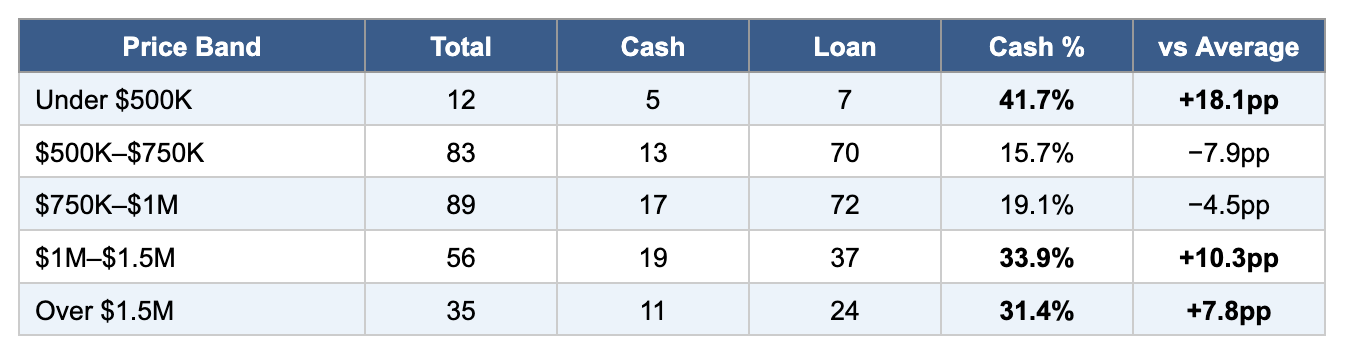
The $500K–$1M band — the core owner-occupier market — shows cash rates well below average at 15.7% to 19.1%. These are primary residence buyers, stretching on financing, competing hard for every available home.
Above $1M, cash rates surge back to 33–34%. These are wealth-driven buyers — Bay Area executives, successful entrepreneurs, people deploying capital from a liquidity event or a portfolio rebalancing. For them, avoiding a financing contingency isn't just convenient; it's a strategic advantage in a negotiation.
And at the sub-$500K end, 41.7% paid cash. This is a different buyer profile entirely — investors who move quickly, skip inspections, and close fast. The data shows they're still very active in Sonoma County.
Why does this U-shape matter to you? If you're considering a property in the $1M+ range as a lifestyle investment, you'll be competing with cash buyers more often than you might expect. Having your financing arranged, your due diligence prepared, and your offer structured to be clean and competitive is not optional — it's essential.
It seems intuitive that more competition should push prices higher. The data confirms this — but with an important caveat about scale.
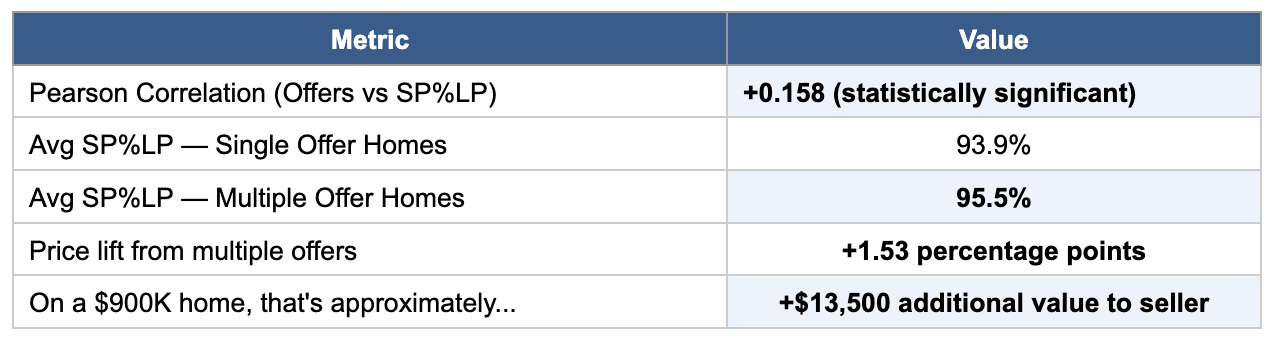
The correlation is real — more offers do push prices up — but the effect is moderate rather than dramatic. On a $900,000 property, multiple offers deliver approximately $13,500 in additional value to the seller. That's meaningful, but it's not transformational.
What this tells us is that the primary driver of price in this market is accurate initial pricing, not bidding wars. A well-priced home in a good location will consistently outperform an overpriced home that eventually generates interest after multiple price reductions. The sellers achieving the best outcomes are those who price strategically from day one, not those who swing for the fences hoping competition will bail them out.
When you classify Sonoma County's cities into lifestyle and luxury markets versus commuter-oriented markets, one of the most striking findings in the entire dataset emerges.
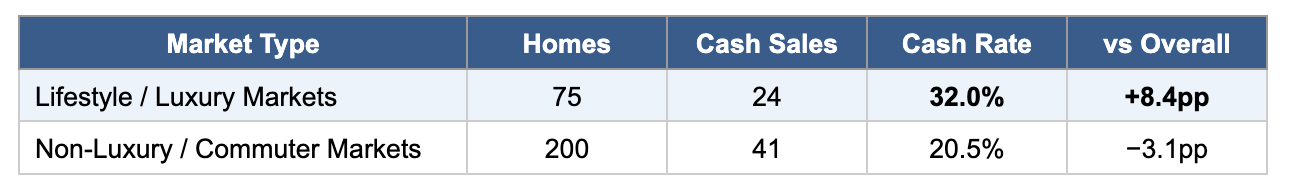
*Lifestyle markets include: The Sea Ranch, Bodega Bay, Glen Ellen, Healdsburg, Calistoga, Sonoma, Sebastopol
Lifestyle markets attract 32% cash buyers versus 20.5% in non-luxury markets — an 11.5 percentage point differential. This isn't a statistical curiosity. It reflects the nature of who is buying in wine country and why.
The buyers in Healdsburg, Sonoma, Glen Ellen, and Sebastopol are disproportionately people who have already made their money. They're buying because they want to wake up to vineyard views, walk to a farmers' market, drink world-class wine, and feel part of a community that aligns with their values. They are deliberate, confident, and well-capitalised.
For those of you reading this from the Bay Area and considering whether to make a move to wine country — or invest in a second property here — that buyer profile is your peer group in this market. And it's why Sonoma County's lifestyle markets have consistently held their value through cycles that have punished other California markets.
This is the most competitive segment of the Sonoma County market, and the data proves it. Sale-to-list ratios of 96–97%, multiple offer rates of 33–36%, and a buyer pool far larger than available supply. You need to be pre-approved, decisive, and willing to move quickly. The good news is that even here, most homes are still closing below asking price — the market isn't out of control. But hesitation is your biggest enemy.
You have negotiating room and time that buyers in the affordable segments simply don't enjoy. The luxury market's sale-to-list ratio of 88–91% means there is a real and meaningful gap between asking and selling price — and that gap is your opportunity. Don't be put off by the fact that 45% of homes over $1.5M attract multiple offers; those offers are typically not at asking price. Be patient, be thorough on your due diligence, and understand that the right property at the right price is the target, not simply the first available option.
Pricing is everything. The data is unambiguous: the mid-market segment delivers the best outcomes for sellers who price correctly from the outset. Luxury sellers who chase an aspirational number typically end up selling at a larger discount, having carried the property longer and attracted less serious buyer interest along the way. Work with an agent who will give you honest guidance over flattering estimates.
The fundamentals here remain compelling. High cash buyer rates in lifestyle markets signal long-term conviction from sophisticated investors. The persistence of buyer demand across multiple price points, even in a higher interest rate environment, speaks to the enduring appeal of wine country living. Whether you're looking at a primary residence, a second home that generates short-term rental income, or a longer-term capital appreciation play, the data supports a positive case for Sonoma County real estate heading into 2026.
Real estate decisions of this magnitude deserve analysis that goes beyond headlines and intuition. The 275 transactions captured in this December 2025 dataset reveal a market of genuine complexity — one where understanding the distinction between a Cotati family home and a Sonoma wine country estate, between a cash-driven luxury buyer and a first-time buyer stretching to make a mortgage work, is the difference between a good outcome and a great one.
Sonoma County has consistently rewarded those who understand it deeply and invest in it thoughtfully. The data suggests December 2025 was no exception.
David Hargreaves | BruingtonHargreaves
contact@bruingtonhargreaves.com.com | Analysis based on 275 residential transactions, December 2025.
Sonoma County Housing Market 2025
The Sonoma Life: A New Chapter of Living in Wine Country
Imagine leaving behind the constant buzz of city life for a place where the pace slows down just enough to appreciate life's finer moments. Where morning fog gives way to sun-drenched afternoons, and your evening commute might involve a scenic drive past rolling vineyards instead of gridlocked highways. This is the reality for those who choose to make Sonoma County their home.
For the first time since 2020, California is experiencing a net positive migration, with Sonoma County emerging as a particularly attractive destination. The reasons are as diverse as the landscape itself – from the dramatic Pacific coastline to the inland valleys dotted with world-class wineries.
Sign in with your email address
Enter your email address


