
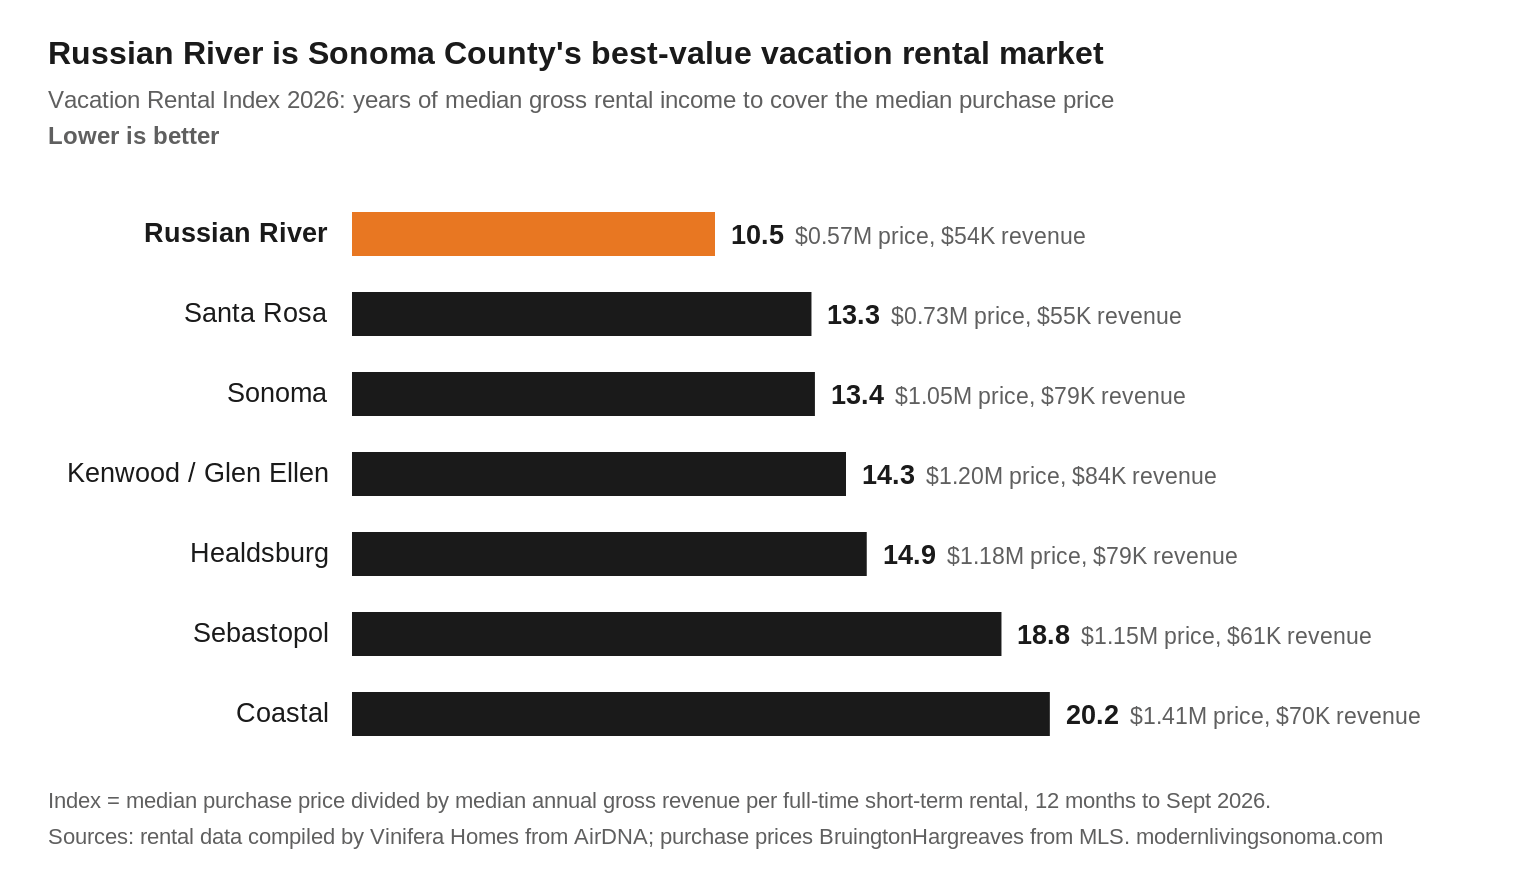
The Russian River is the best-value vacation rental market in Sonoma County in 2026. A median-priced home there costs 10.5 years of median gross rental income, against 13.3 in Santa Rosa, 13.4 in Sonoma and 20.2 on the coast. Kenwood / Glen Ellen earns the most per home, at $83,941 a year, while Healdsburg has grown fastest, with revenue per listing up 25% in two years.
The Vacation Rental Index divides the median purchase price in each market by the median annual gross revenue of a full-time vacation rental there. It answers one question: how many years of gross income does it take to cover what you pay for the home? This 2026 edition covers seven Sonoma County markets over the twelve months to September 2026, using AirDNA data compiled by Vinifera Homes and MLS sales prices.
The 2026 Vacation Rental Index Ranking
| Rank | Market | Median purchase price | Median annual revenue | Vacation Rental Index |
|---|---|---|---|---|
| 1 | Russian River | $567,000 | $54,075 | 10.5 |
| 2 | Santa Rosa | $729,000 | $54,803 | 13.3 |
| 3 | Sonoma | $1,055,000 | $78,964 | 13.4 |
| 4 | Kenwood / Glen Ellen | $1,200,000 | $83,941 | 14.3 |
| 5 | Healdsburg | $1,182,000 | $79,364 | 14.9 |
| 6 | Sebastopol | $1,154,000 | $61,324 | 18.8 |
| 7 | Coastal | $1,413,000 | $69,872 | 20.2 |
Lower is better: fewer years of gross revenue to cover the purchase price. The index is gross, before property tax, insurance, financing, set-up costs, maintenance and management, so treat it as a way to compare markets rather than a measure of profit.
How the Index Works
Median purchase price ÷ median annual gross revenue = Vacation Rental Index. It is the same construction as our 2022 index, so the two can be compared.
- Revenue is the median gross booking revenue (nightly rate plus cleaning fees) of individual full-time short-term rentals, meaning homes available 180 or more nights a year, over the twelve months to September 2026.
- Purchase price is the median sold price of homes in each area from October 2025 to September 2026, from MLS.
- Purchase prices cover all homes sold in each area, not only homes that qualify for a vacation rental permit. In the wine-country markets, eligible homes usually sell for more than the area median, so the real index there is higher. Our guide to Sonoma County vacation rental rules explains which homes qualify.
The Markets at a Glance
Healdsburg, Sonoma and Kenwood / Glen Ellen earn the most per home; Santa Rosa has the highest occupancy; the Russian River has the lowest price of entry.
| Metric | Healdsburg | Sonoma | Kenwood / Glen Ellen | Santa Rosa | Russian River | Sebastopol | Coastal |
|---|---|---|---|---|---|---|---|
| Active rentals | 211 | 520 | 180 | 456 | 447 | 181 | 379 |
| Median daily rate | $552 | $580 | $623 | $331 | $350 | $310 | $461 |
| Median occupancy | 51% | 49% | 50% | 60% | 50% | 56% | 52% |
| Median annual revenue | $79,364 | $78,964 | $83,941 | $54,803 | $54,075 | $61,324 | $69,872 |
| 1 bedroom | $45,162 | $37,759 | $34,774 | $27,723 | $35,328 | $33,675 | $47,257 |
| 2 bedroom | $53,192 | $53,766 | $64,969 | $44,021 | $47,753 | $53,625 | $63,385 |
| 3 bedroom | $99,824 | $86,629 | $100,405 | $66,459 | $63,650 | $78,489 | $74,333 |
| 4 bedroom | $157,197 | $135,311 | $114,206 | $111,719 | $87,690 | $94,175 | $90,140 |
| 5 bedroom | $170,474 | $237,699 | $155,676 | $144,360 | $94,848 | $130,321 | $149,914 |
| Median purchase price | $1,182,000 | $1,055,000 | $1,200,000 | $729,000 | $567,000 | $1,154,000 | $1,413,000 |
| Median sale price change, Jul-Sep 2025 to Jul-Sep 2026 | +14.8% | -12.9% | +21.5% | -2.5% | +4.0% | +5.7% | +12.9% |
| Vacation Rental Index | 14.9 | 13.4 | 14.3 | 13.3 | 10.5 | 18.8 | 20.2 |
Active rentals: AirDNA active listing count, October 2026. Median daily rate, occupancy and annual revenue: medians of Healdsburg 162, Sonoma 396, Kenwood / Glen Ellen 138, Santa Rosa 290, Russian River 393, Sebastopol 138 and Coastal 341 individual full-time listings, trailing 12 months. Five-bedroom samples are small in Sebastopol (8), Healdsburg (11) and Kenwood / Glen Ellen (13). Russian River = Guerneville, Monte Rio, Rio Nido and the river corridor. Coastal = Bodega Bay, Jenner and the Sonoma Coast. The price change compares median sale prices in July-September 2025 with July-September 2026; quarterly samples are small, so read it as a direction rather than a precise figure.
Typical Home vs Well-Run Home
The top quarter of homes in every market earns 1.4 to 1.8 times the median, in the same area with the same bedroom count. The gap comes from presentation, pricing, reviews and amenities, which are the things a buyer controls after closing.
| Market | 2 Bed: Median | 2 Bed: Top Quarter | 3 Bed: Median | 3 Bed: Top Quarter | 4 Bed: Median | 4 Bed: Top Quarter |
|---|---|---|---|---|---|---|
| Healdsburg | $53K | $80K | $100K | $126K | $157K | $228K |
| Sonoma | $54K | $97K | $87K | $125K | $135K | $199K |
| Kenwood / Glen Ellen | $65K | $96K | $100K | $128K | $114K | $201K |
| Santa Rosa | $44K | $57K | $66K | $84K | $112K | $148K |
| Russian River | $48K | $65K | $64K | $81K | $88K | $120K |
| Sebastopol | $54K | $72K | $78K | $93K | $94K | $128K |
| Coastal | $63K | $87K | $74K | $100K | $90K | $120K |
Annual gross revenue per listing, trailing 12 months, full-time listings. Median = the typical home; top quarter = the 75th percentile. Share of full-time homes earning $100,000 or more a year: Healdsburg 39%, Sonoma 39%, Kenwood / Glen Ellen 39%, Santa Rosa 24%, Russian River 11%, Sebastopol 20%, Coastal 22%. Four in ten in the wine-country towns; one in ten on the river.
Seasonality: When Sonoma County Vacation Rentals Earn
Every market earns 42-47% of its year from June to September, but the winter trough is deeper in some areas than others. That matters for cash flow, and for owners who want to use the home themselves in the off-season.
| Market | Best Month | Avg. Revenue, Best Month | Slowest Month | Avg. Revenue, Slowest Month | Best ÷ Slowest |
|---|---|---|---|---|---|
| Healdsburg | Jun ’26 | $12,088 | Feb ’26 | $4,455 | 2.7x |
| Sonoma | Jul ’26 | $11,846 | Feb ’26 | $4,901 | 2.4x |
| Kenwood / Glen Ellen | Aug ’26 | $12,909 | Jan ’26 | $5,014 | 2.6x |
| Santa Rosa | Jul ’26 | $8,128 | Jan ’26 | $3,591 | 2.3x |
| Russian River | Jul ’26 | $8,886 | Feb ’26 | $2,955 | 3.0x |
| Sebastopol | Jul ’26 | $8,432 | Jan ’26 | $3,579 | 2.4x |
| Coastal | Jul ’26 | $10,304 | Feb ’26 | $4,607 | 2.2x |
Average monthly gross revenue per active listing, October 2025 to September 2026. Occupancy peaks at 70-76% in July on the river, the coast, Santa Rosa and Sebastopol, and 61-63% in the wine-country towns, where higher nightly rates do more of the work.
- Russian River is the most seasonal: July earns three times what February does, and 47% of the year lands in June to September.
- The coast is the least seasonal: a 2.2x swing, and November ($6,476 average) is nearly as good as October.
- Santa Rosa holds up best in winter: 48% occupancy in January against 34-42% everywhere else, with business, medical and family travel filling the gap.
Three-Year Trend
Healdsburg revenue per listing is up 25% in two years; Sonoma and Kenwood / Glen Ellen are flat. Average revenue per active listing over the last twelve months, against the same period two years earlier (October 2023 to September 2024):
| Market | Avg. Annual Revenue, 2 Yrs Ago | Avg. Annual Revenue, Last 12 Mo | Revenue Change | Daily Rate Change | Occupancy Change |
|---|---|---|---|---|---|
| Healdsburg | $86,952 | $108,487 | +25% | +17% | +2.9 pts |
| Sonoma | $106,666 | $108,010 | +1% | +2% | -1.1 pts |
| Kenwood / Glen Ellen | $113,453 | $112,398 | -1% | -6% | +2.0 pts |
| Santa Rosa | $67,747 | $70,899 | +5% | +5% | -0.5 pts |
| Russian River | $58,722 | $62,393 | +6% | +2% | +1.7 pts |
| Sebastopol | $66,021 | $70,616 | +7% | +8% | +0.6 pts |
| Coastal | $75,674 | $82,578 | +9% | +5% | +0.1 pts |
- Healdsburg is the stand-out: up 25% in two years on a 17% rise in nightly rate and three points of occupancy, with the listing count flat since 2022.
- Sonoma and Kenwood / Glen Ellen are flat (+1% and -1%). They are still the highest-earning markets, but the growth has gone elsewhere. In Kenwood / Glen Ellen the nightly rate is down 6% and occupancy up two points: owners are trading rate for nights.
- The value markets are growing steadily: Coastal +9%, Sebastopol +7%, Russian River +6%, Santa Rosa +5%, all of it on rate rather than occupancy.
The Hot Tub Premium
A hot tub adds 14% to 70% to the median three-bedroom's revenue. The premium is biggest in the wine-country towns and Santa Rosa and smallest on the river, where most homes already have one.
| Market | 3-Bed With Hot Tub (Median) | 3-Bed Without (Median) | Premium | Share Of Full-time Listings With A Hot Tub |
|---|---|---|---|---|
| Healdsburg | $112,562 (n=26) | $86,638 (n=21) | +30% | 44% |
| Sonoma | $104,077 (n=59) | $66,114 (n=48) | +57% | 43% |
| Kenwood / Glen Ellen | $110,608 (n=27) | $65,227 (n=9) | +70% | 59% |
| Santa Rosa | $85,966 (n=28) | $53,071 (n=43) | +62% | 37% |
| Russian River | $68,125 (n=88) | $59,983 (n=47) | +14% | 60% |
| Sebastopol | $89,022 (n=15) | $66,657 (n=13) | +34% | 38% |
| Coastal | $79,274 (n=54) | $64,696 (n=55) | +23% | 46% |
Median annual gross revenue, trailing 12 months, 3-bedroom full-time listings. Homes with hot tubs also tend to be better presented overall, so read the premium as an upper bound on the hot tub alone.
Market by Market
- Russian River (index 10.5, rank 1): lowest median revenue ($54K) and the most seasonal, but the lowest price of entry, which is why it tops the index again. 447 active rentals, up sharply since 2022, making it the most competitive market in the county.
- Santa Rosa (13.3, rank 2): highest occupancy (60% median) and the best winter floor. A lower price of entry, and 4- and 5-bedrooms ($112K / $144K median) that hold their own against wine country. Small homes are weak here: 1-bedrooms median $28K.
- Sonoma (13.4, rank 3): the deepest market (520 active rentals) and the best large-home earner, with 5-bedrooms at a $238K median. Revenue per home has been flat for three years, so underwrite on today's numbers, not on growth.
- Kenwood / Glen Ellen (14.3, rank 4): highest median revenue ($84K) and nightly rate ($623) on the smallest listing count (180). Scarcity is the story. The hot tub premium on 3-beds (+70%) is the largest anywhere.
- Healdsburg (14.9, rank 5): the fastest-improving market in the county (+25% revenue per listing in two years) and the strongest 4-bedroom numbers ($157K median, $228K top quarter). Listing count flat since 2022.
- Sebastopol (18.8, rank 6): middle of the pack and steady: 56% occupancy, $61K median, +7% in two years. Fewer listings (181) than the markets on either side of it.
- Coastal (20.2, rank 7): the best small-home market in the county (1-bedrooms median $47K, 2-bedrooms $63K, both the highest of any area) and the flattest season. Large homes earn less here than inland.
Frequently Asked Questions
Where is the best place to buy a vacation rental in Sonoma County?
On the index, the Russian River: a median home costs 10.5 years of median gross revenue. For the highest income per home, Kenwood / Glen Ellen, Healdsburg and Sonoma lead, with median revenue of $79,000 to $84,000 a year.
How much does a Sonoma County vacation rental earn?
The median full-time vacation rental earned between $54,075 (Russian River) and $83,941 (Kenwood / Glen Ellen) in gross revenue over the twelve months to September 2026. Well-run homes in the top quarter earn 1.4 to 1.8 times the median.
What occupancy do Sonoma County vacation rentals get?
Median occupancy runs from 49% in Sonoma to 60% in Santa Rosa. July occupancy peaks at 70-76% on the river, the coast, Santa Rosa and Sebastopol.
Can any home be used as a vacation rental?
No. Most cities are closed to new whole-house rentals and permits do not transfer when a home sells. See our guide to Sonoma County vacation rental rules for the full eligibility check.
Sources and Methodology
Rental data compiled by Vinifera Homes from AirDNA, twelve months to September 2026. Purchase prices: BruingtonHargreaves, from MLS.
- Listing-level figures (the index, the markets at a glance, typical vs well-run homes, hot tubs): AirDNA export of 1,858 individual full-time listings (available 181+ nights a year) across the seven markets, trailing twelve months. Medians and quartiles are of individual homes.
- Market-level figures (seasonality and the three-year trend): AirDNA market data for each area, monthly, October 2023 to September 2026. Revenue is the average gross booking revenue per active listing; ADR is the average achieved nightly rate; occupancy is booked nights as a share of available nights.
- Active rentals: AirDNA active listing count per area, October 2026.
- Market definitions: Russian River = AirDNA Guerneville submarket (Guerneville, Monte Rio, Rio Nido, Cazadero, Duncans Mills). Coastal = AirDNA Bodega Bay submarket plus Jenner. Kenwood / Glen Ellen = AirDNA Glen Ellen submarket.
- All revenue figures are gross: before lodging taxes, platform fees, management fees, cleaning costs and all operating expenses.
We check every property that comes on the market against the county's vacation rental rules. Sign up for access to our private list of eligible vacation rentals, or book a free call to talk through a specific market.
About the Author
David Hargreaves is the co-founder of BruingtonHargreaves, one of Sonoma County's top-ranked real estate teams and part of W Real Estate. Originally from the UK and an Oxford University graduate, David built and ran a digital marketing agency serving Google, Facebook, and other major brands before becoming one of Sonoma County's top agents within three years of entering real estate.
Today he and business partner Jonathan Bruington have sold more than $250 million in Sonoma County homes over the past three years, earning recognition as a RealTrends No. 2 team in the county and the No. 1 team in Healdsburg. David specialises in helping Bay Area buyers and sellers with luxury properties and vacation rentals across Healdsburg, Windsor, Santa Rosa, and the Russian River communities.
He lives in Sonoma County with his wife Nancy and is happiest cycling the back roads, exploring local wineries, or behind a camera. Have a question about buying, selling, or building in Wine Country? Book a free call.