
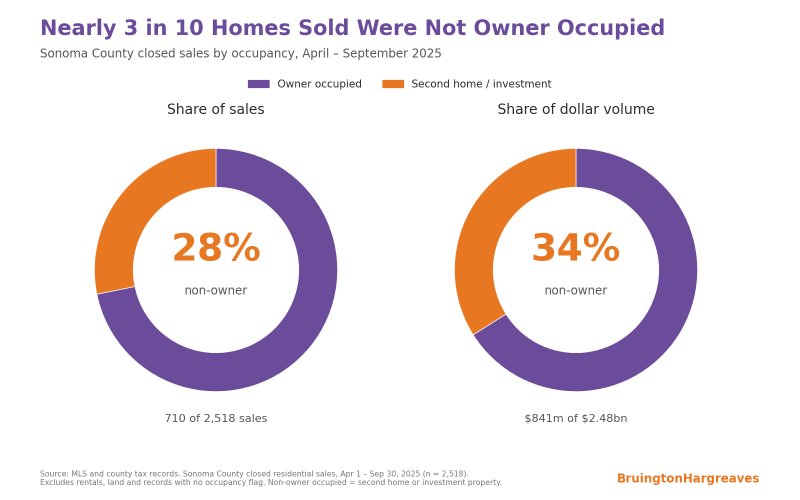
Most Sonoma County homes still go to people who plan to live in them, but nearly 3 in 10 do not. From April to September 2025, 710 of the 2,518 homes sold in Sonoma County (28%) were bought as second homes or investments. Those buyers spent $841 million, or 34% of the $2.48 billion total.
That ties into a national trend. Realtor.com's October 2026 investor report, published this month, found that small investors, not Wall Street funds, now do most investor buying. In the first half of 2026, investors made 10.7% of U.S. home purchases, and small investors with 10 or fewer purchases accounted for 66.2% of them, their highest share in at least 15 years. Large and mega investors sold more homes than they bought.
National investors vs Sonoma County second-home buyers
The two numbers measure different things, so don't compare them directly. Realtor.com counts corporate buyers such as LLCs and trusts purchasing homes they won't live in. Our local analysis of MLS and county tax records counts every buyer who did not make the home their main residence, including individuals buying a weekend place. The local data can't separate a second home from a rental.
Both point the same way, though: the buyer you compete with, or sell to, is usually a person, not an institution. Nationally, 55.5% of investor purchases were all cash, against 30.0% across the whole market, so expect these buyers to come with strong terms.
Where second-home buyers are buying in Sonoma County
Sonoma County splits in two. The coast, Russian River, Healdsburg, West County and Sonoma Valley are second-home markets. The Highway 101 corridor is mostly people moving in.
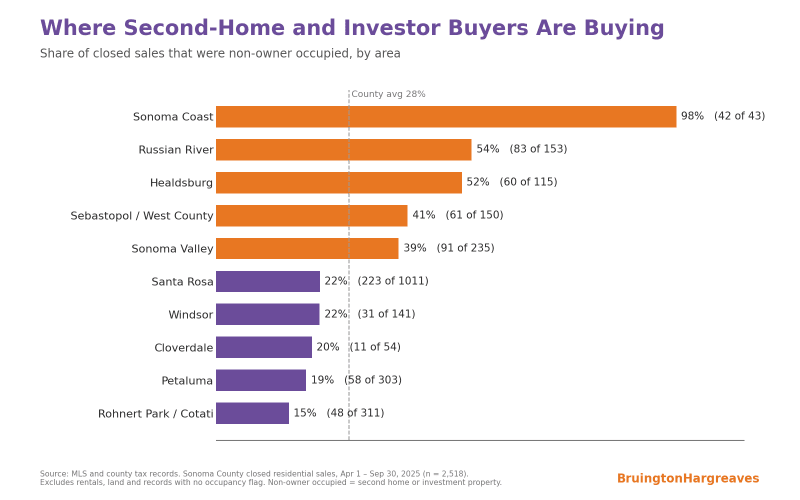
The Sonoma Coast (Bodega Bay and The Sea Ranch) is almost entirely second homes: 42 of 43 sales. In the Russian River, 54% of buyers didn't move in, led by Cazadero (65%), Monte Rio (60%), Guerneville (47%) and Forestville (45%). This is the heart of Sonoma County's vacation rental market, and the natural place to start if you want a vacation rental investment. Healdsburg came in at 52%, and those buyers made up 60% of the town's dollar volume.
Along the 101, the picture flips. Petaluma sits at 19%, Windsor at 22%, and Rohnert Park, Cotati and Penngrove at 15%. Santa Rosa is 22%, but it is so large that it still logged the most non-owner purchases of any area: 223, or 31% of the county total.
Above $2 million, most buyers already live somewhere else
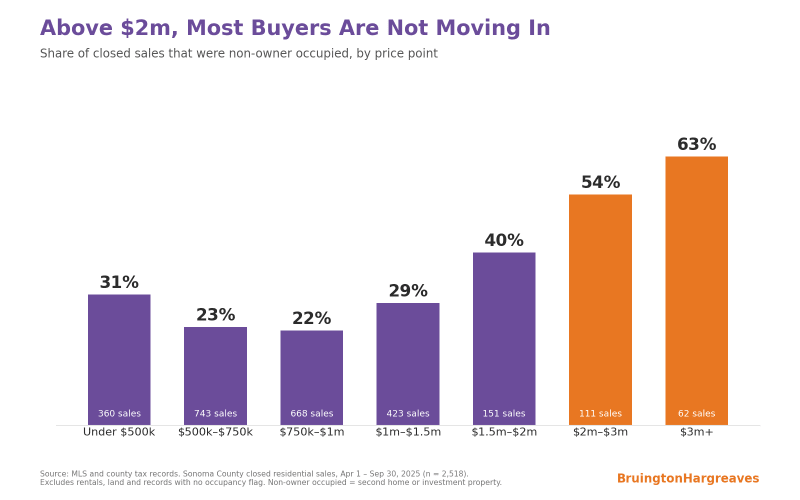
Plot the share by price and you get a U shape. Under $500,000, 31% of buyers were non-owners, helped by Russian River cabins. The $500,000 to $1 million middle is the most owner-occupied part of the market, at 22-23%. From there the share climbs: 29% at $1 million to $1.5 million, 40% at $1.5 million to $2 million, 54% at $2 million to $3 million and 63% above $3 million. Above $2 million, 99 of 173 sales (57%) went to buyers who did not move in.
Most second-home buying still happens at mid-range prices, though. Of all non-owner purchases, 60% were under $1 million and 77% were under $1.5 million. That echoes the national picture of smaller buyers doing most of the buying.
Healdsburg and Sonoma Valley lead at the top
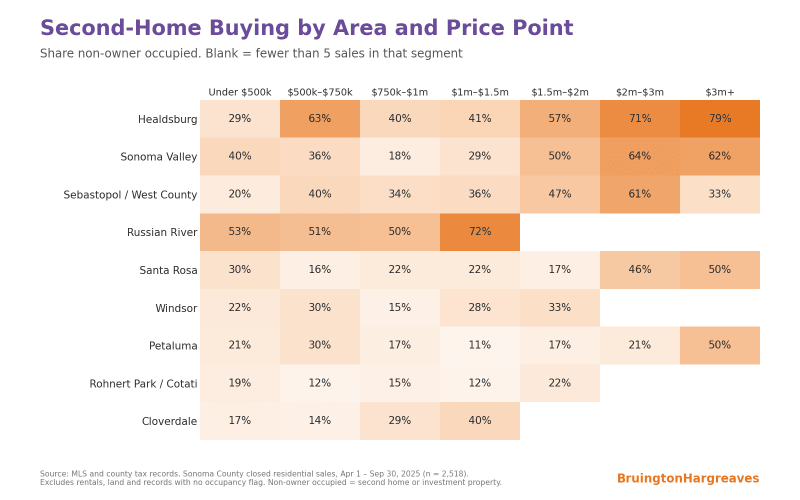
In Healdsburg, 16 of 21 sales above $2 million (76%) went to non-owners, including 11 of 14 above $3 million. Sonoma Valley had the most non-owner sales above $2 million of any area: 33 of the county's 99. Even in Santa Rosa, the share jumps from 16-22% between $500,000 and $2 million to 46-50% above $2 million.
If you're selling a Healdsburg home or a property in one of Sonoma County's luxury neighbourhoods, your buyer probably already owns a home somewhere else. The marketing has to reach them there.
What each type of buyer paid
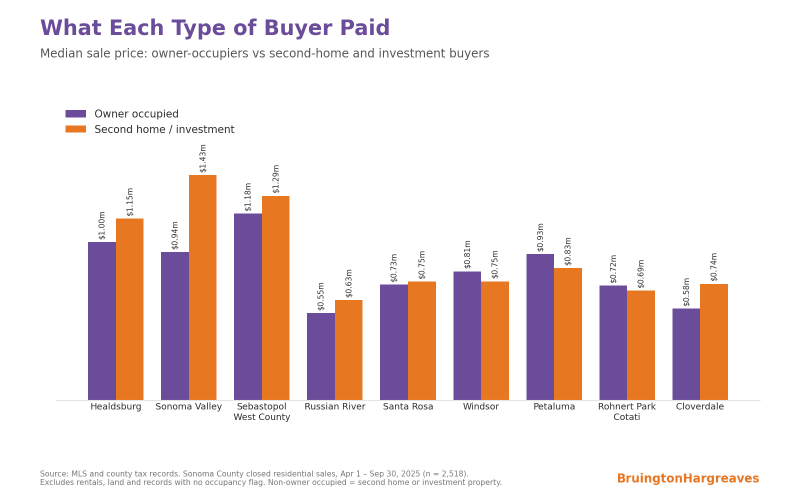
Non-owner buyers paid more on average, $1.18 million against $904,000, though the medians are closer at $830,000 and $775,000. The biggest gap is in Sonoma Valley, with a median of $1.43 million for non-owners against $938,000 for owner occupiers. In Healdsburg it was $1.15 million against $1.00 million, and in Sebastopol and West County $1.29 million against $1.18 million.
In Windsor, Petaluma and Rohnert Park the gap reverses, and non-owners paid slightly less. That suggests two different buyers: lifestyle second-home buyers in the wine and coast towns, and rental investors along the 101, much closer to the small-investor profile in the national report. Demand held steady all summer, between 25% and 30% every month, peaking at 30% in May and June.
About the data
Local figures are a BruingtonHargreaves analysis of MLS and Sonoma County tax records: 2,518 closed residential sales from April 1 to September 30, 2025, excluding rentals, land and records with no occupancy flag. Owner-occupied status comes from the tax roll, so a few recent buyers who had not yet filed a homeowner's exemption may show as non-owners. National figures come from Realtor.com's October 2026 investor report, covering the first half of 2026.
Weighing a second home or investment property in Sonoma County? Email me directly at david@bruingtonhargreaves.com.
About the Author
David Hargreaves is the co-founder of BruingtonHargreaves, one of Sonoma County's top-ranked real estate teams and part of W Real Estate. Originally from the UK and an Oxford University graduate, David built and ran a digital marketing agency serving Google, Facebook, and other major brands before becoming one of Sonoma County's top agents within three years of entering real estate.
Today he and business partner Jonathan Bruington have sold more than $250 million in Sonoma County homes over the past three years, earning recognition as a RealTrends No. 2 team in the county and the No. 1 team in Healdsburg. David specialises in helping Bay Area buyers and sellers with luxury properties and vacation rentals across Healdsburg, Windsor, Santa Rosa, and the Russian River communities.
He lives in Sonoma County with his wife Nancy and is happiest cycling the back roads, exploring local wineries, or behind a camera. Have a question about buying, selling, or building in Wine Country? Book a free call.